Predicting Airbnb Rental Prices Across Regions Using Machine Learning
I. Abstract
Over the past few years, Airbnb has become one of the most popular options as a place to stay all across the world. Our team employed the use of a random forest regression model to predict Airbnb pricing using listing features and geographic information. The data used to train our model comes from six major cities within the United States, but through a variety of features and controlling for cost of living, our model is able to successfully generalize to cities in Western Europe far better than baseline predictions. This diverges from models previously created in the space which are constrained to their city or geographic region their training data comes from. Our model's ability to translate universally makes it more accessible.
II. Introduction
Airbnbs are a fantastic way to find a place to stay when visiting a city that offers a more unique experience than staying in a hotel. They are not without their risks, however. Since the owner of the Airbnb controls the pricing, pictures and information you see about a rental property- they can create a somewhat false image of how nice their rental is. This leaves customers at risk of overpaying based upon limited information. On the flip side, it can be difficult for owners to assess the market by looking at other Airbnb’s in their location and creating accurate comparisons to give an idea of how much they should list their property for.
Our model attempts to dispel some of the ambiguity around appropriate Airbnb pricing by evaluating the features, location, and amenities of an Airbnb listing and determining what the average price you would expect to pay for such a property. With this information Airbnb customers can assess if they are paying a reasonable price, and Airbnb hosts can price their listings at a reasonable rate that will help them maximize their revenue and occupancy rate. Additionally, unlike other research that has been previously done around Airbnb price prediction, the aim of our study is to generalize a model beyond just the city or geographic location it was trained on. More specifically, we aim to predict Airbnb property prices per night in western Europe using a model exclusively trained on data from the United States.
III. Background
The problem of evaluating the pricing of a rental property has existed far longer than the introduction of Airbnb. Rental real estate is a massive industry with billions of dollars exchanging hands on an annual basis (Collins et al., 2021).
Our paper leveraged the ideas of several previous research projects done on similar topics. One of the concepts we took was the idea that housing data requires a significant amount of normalization when comparing across markets (Yu et al., 2016). This helps control for some of the external factors affecting prices that are unique to each city. Another idea that ultimately paid dividends for us was the concept of factoring in proximity to the center city (Ma et al., 2018).
Compared to general real estate posts, Airbnb posts include things such as ratings, user reviews, and host longevity. Airbnb rentals are also much shorter than the annual rentals most research in this space focuses on (Bivens et al., 2019). This makes working with the data slightly different as there is a larger social aspect to these decisions. For example, researchers at Stanford used sentiment analysis on reviews to predict Airbnb prices in New York City (Kalehbasti et al., 2019). This is also not the only unique aspect of working with Airbnb data. In the research done by Wang et al., traditionally predictive factors such as ratings and brand affiliation that are good indicators of popularity in the hotels do not seem effective in predicting Airbnb data (2017). Instead, they found host attributes, features and amenities, and property attributes hold the predictive signal key to unlocking an Airbnb’s pricing.
Ultimately, we incorporated many ideas from these research papers into our model design process. However, our research did differ from the aforementioned works in several ways. Most papers focused on specific cities or geographic areas to train and test their models. One focus of our research was to see how our predictions could translate to Western European cities after training exclusively on major cities within the United States, as there are differences in Airbnb etiquette between the two continents, (McMahan et al., 2017). One key difference we found in our study is that the distance to the city center was much more important in American cities than European. We hypothesize that this could be due to the fact that European cities have significantly better public transportation infrastructure giving tourists easier access to downtown areas (Cascajo et al., 2014). The vast majority of previous research on the topic is specific to one city or region, but we believe our model is better architected to generalize across regions.
IV. Data
A. Data Sources
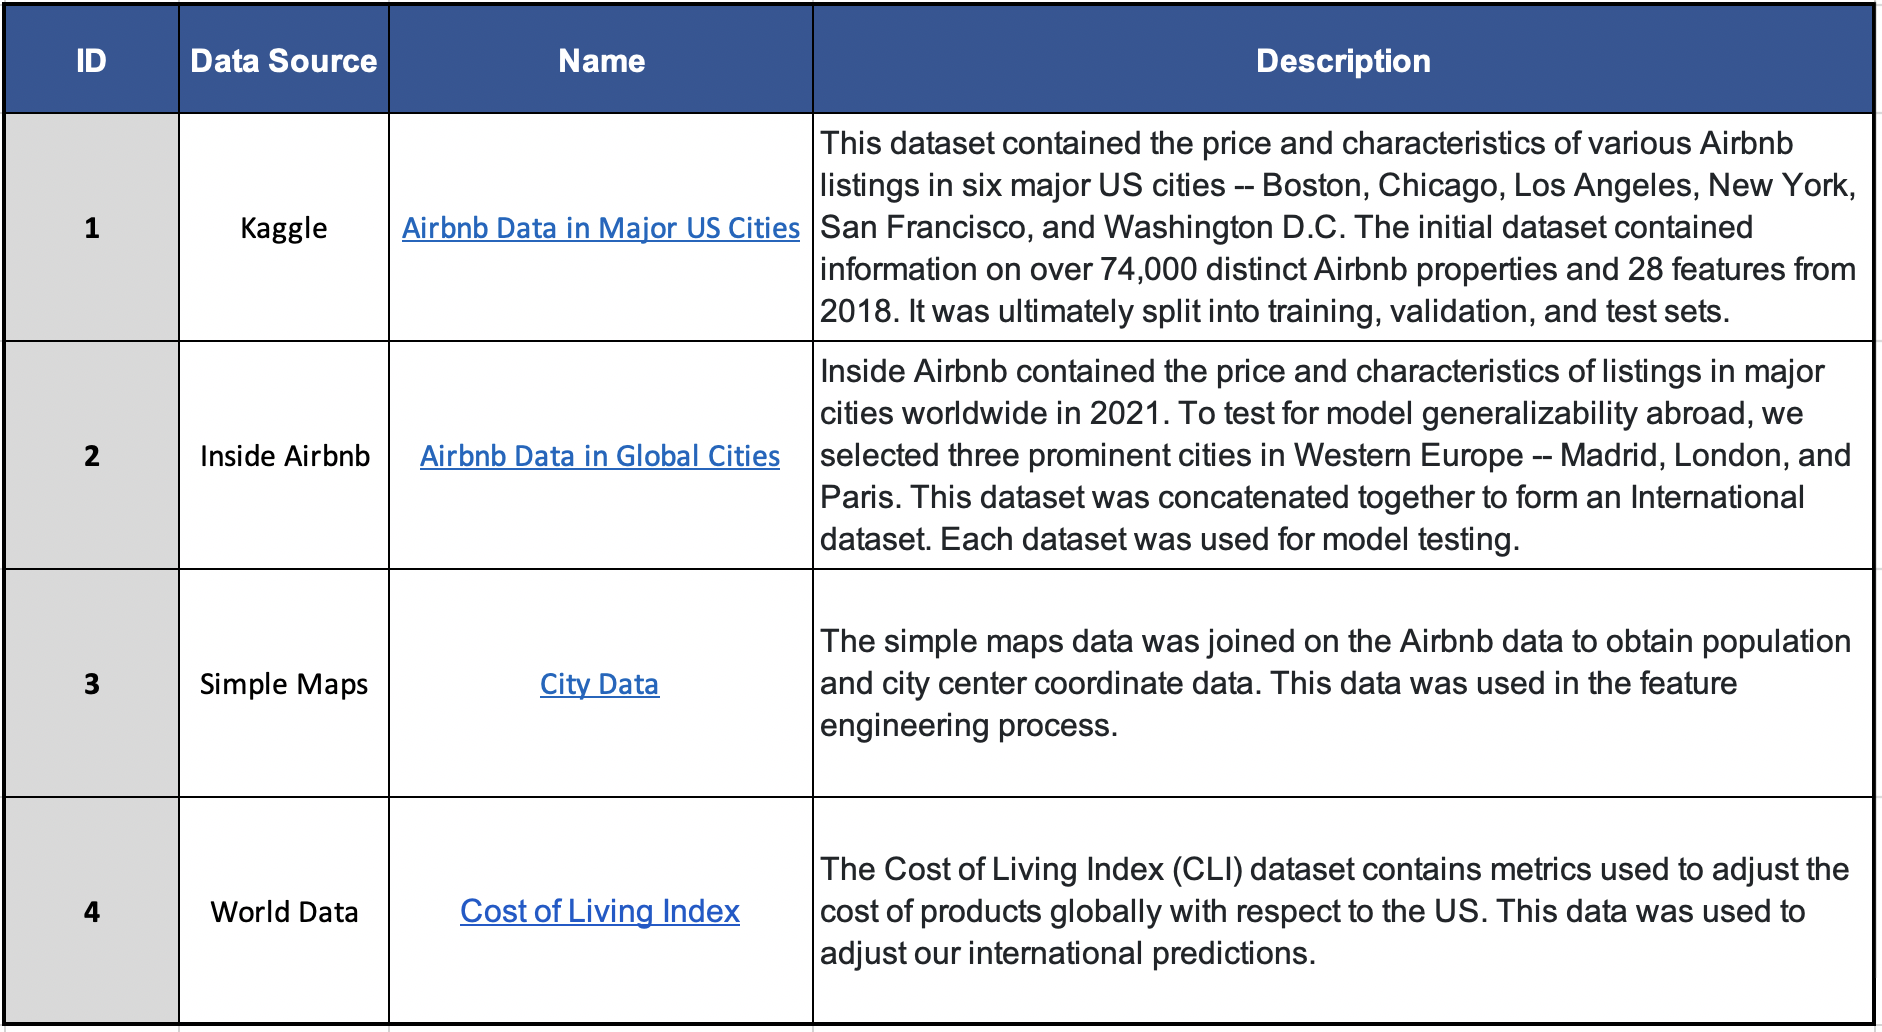
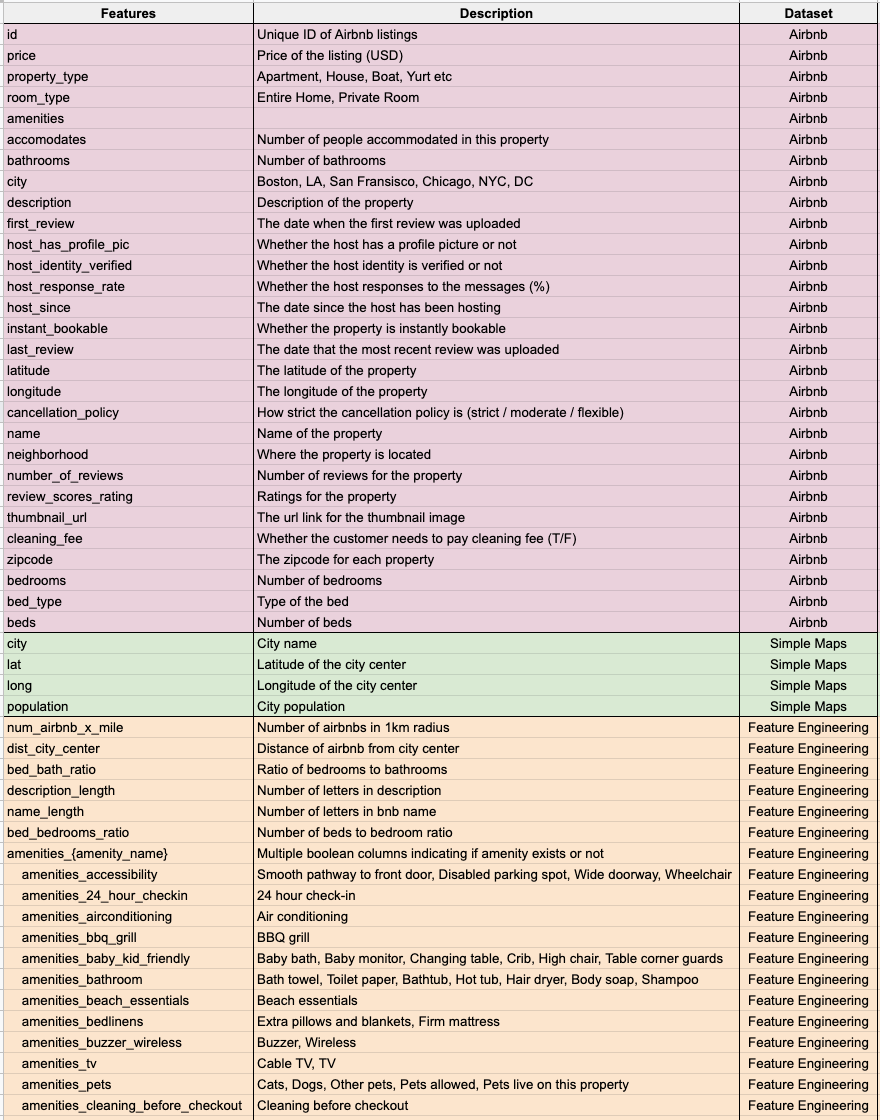
For this study, four datasets were acquired, cleaned, and merged together to create comprehensive train and test datasets. The source, name, and description, of each data source can be found in Table 1 below.
Table 1: Data source, name, and description of each dataset used in the paper.
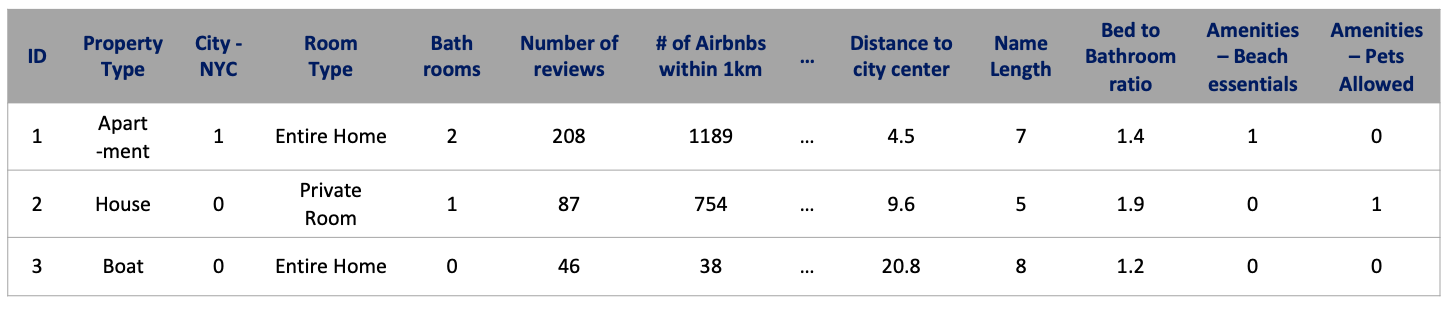
A sample set of features can be seen in Table 1 below and a comprehensive data dictionary can be found in Appendix I.
Table 2: Sample features used in the final training and test sets.
B. Exploratory Data Analysis (EDA)
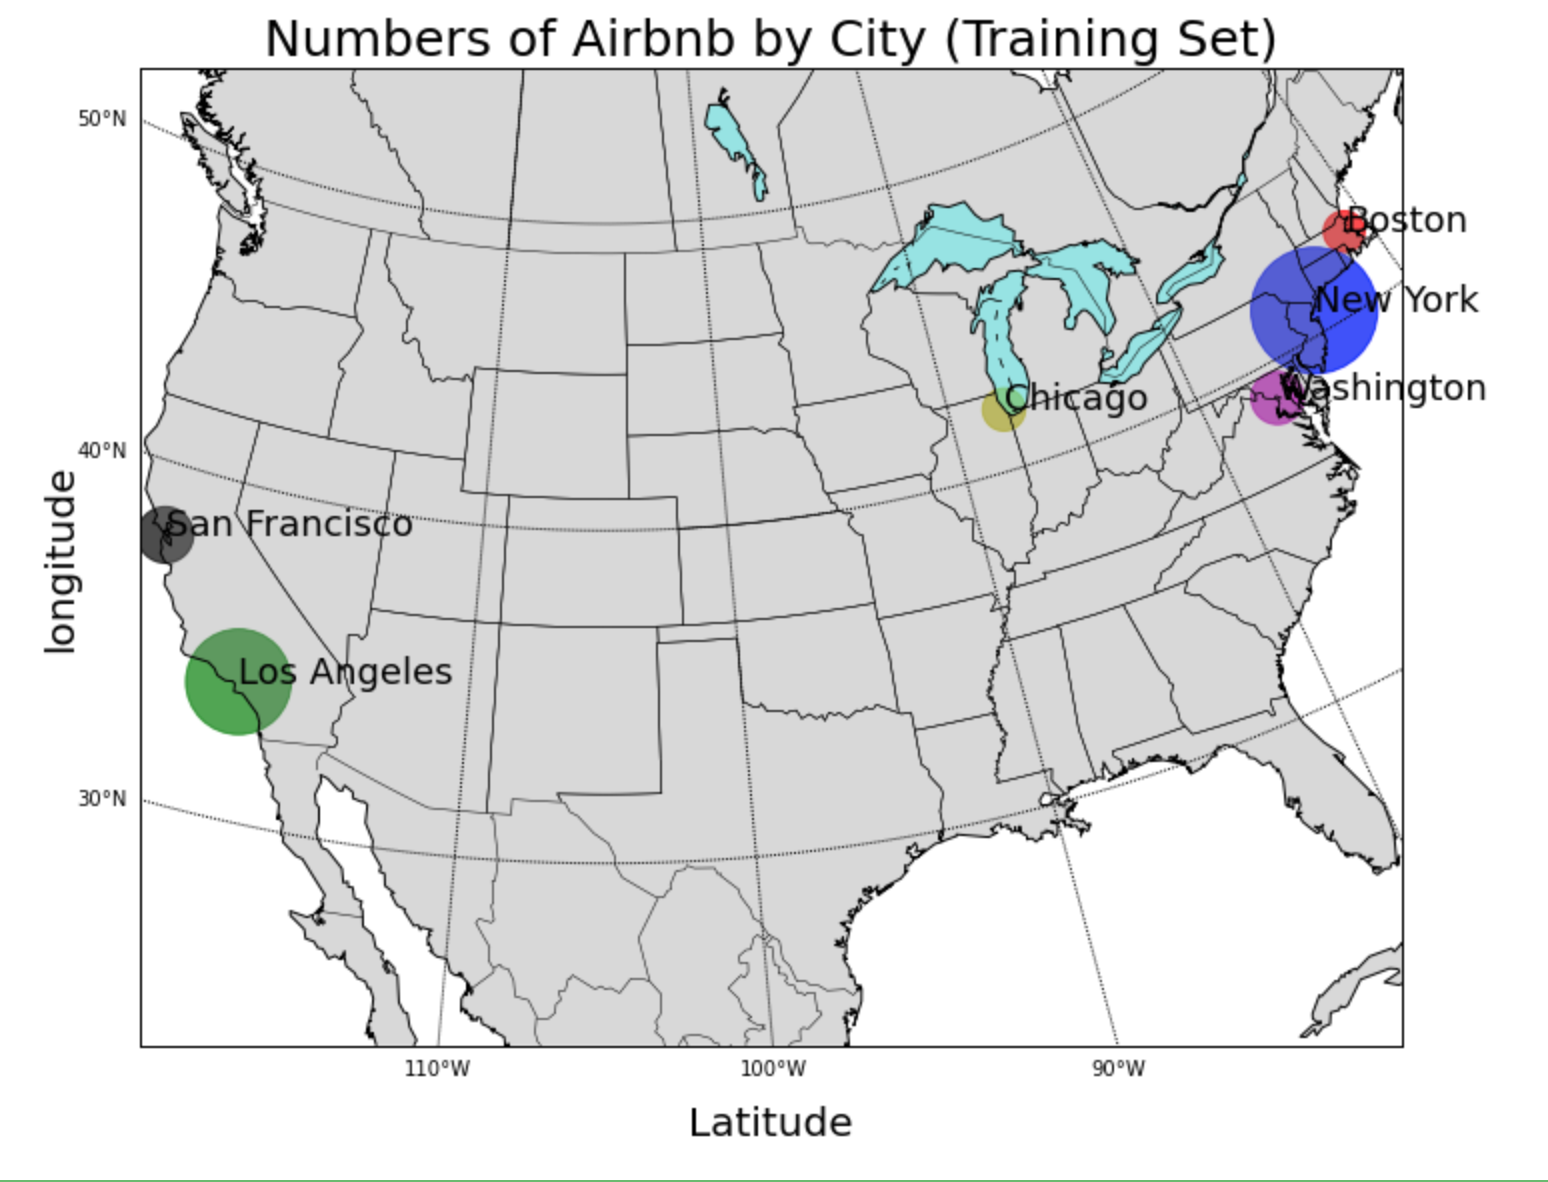
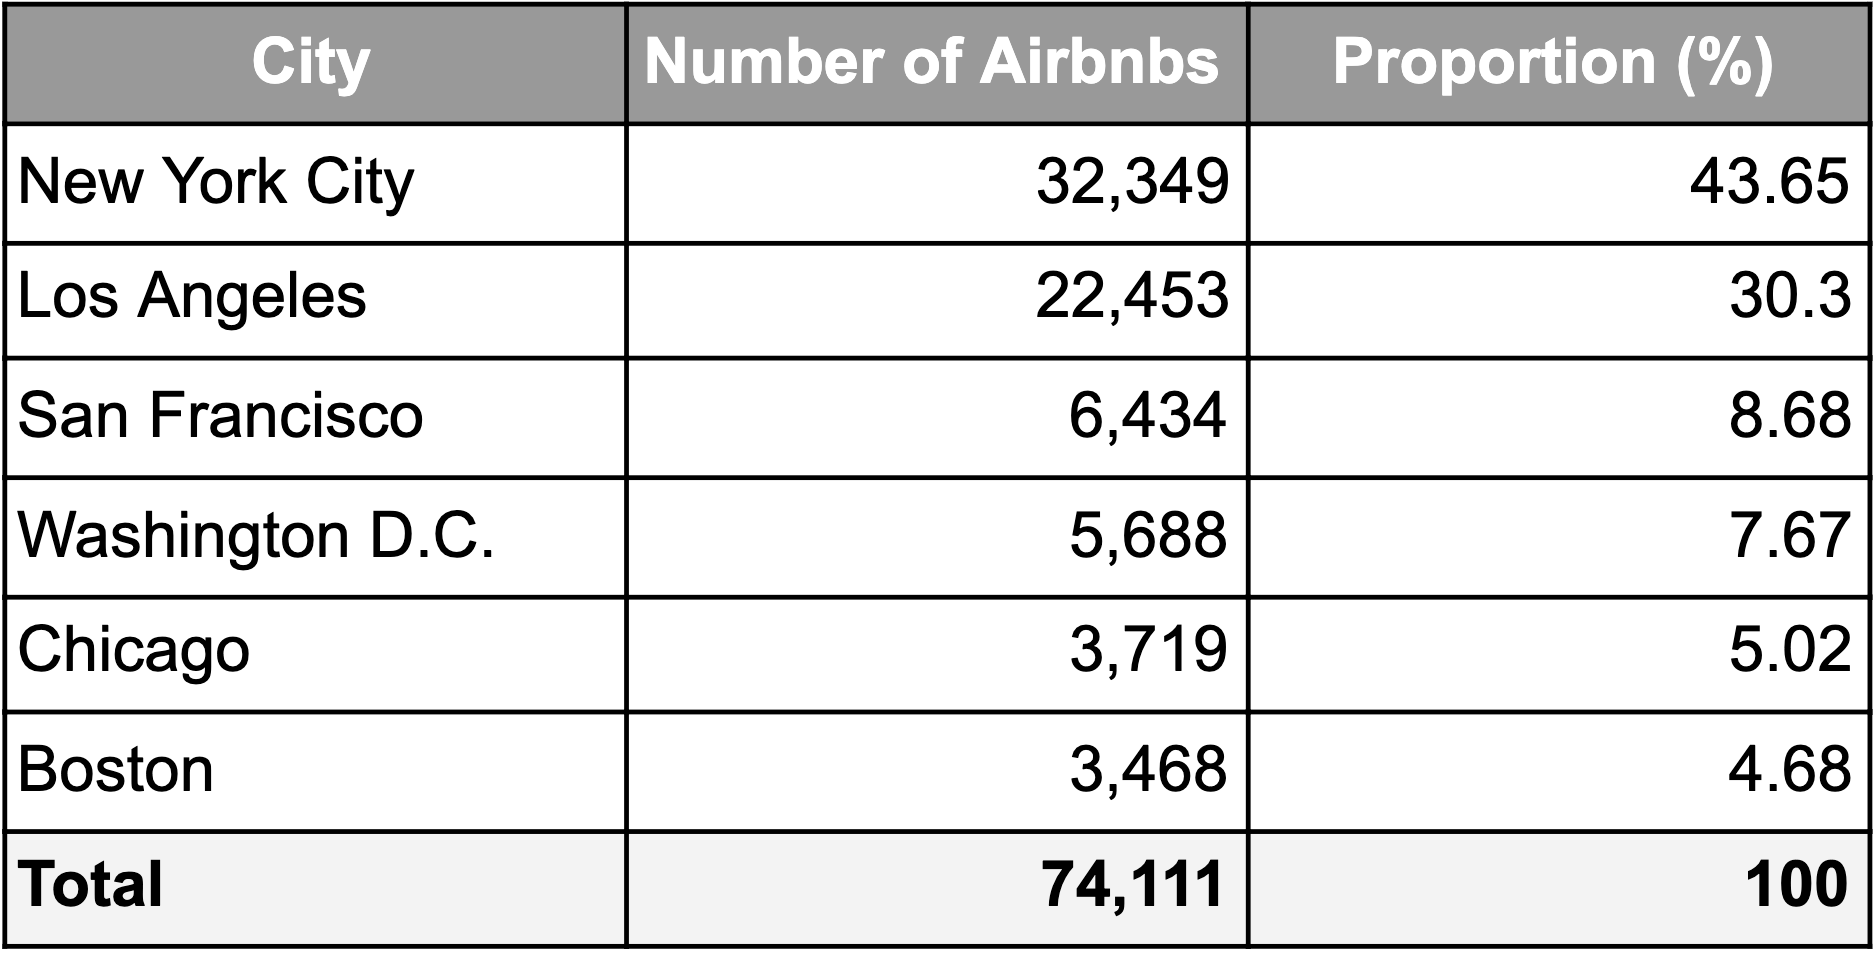
Our training data contained Airbnb properties from six major cities in the United States. A heatmap of the number of listings by city can be seen in Figure 1. Larger circles correspond to more properties contained in the dataset. A large majority of the dataset was from New York and Los Angeles, with a few thousand listings from each of the other cities. The proportion and number of properties by city in the dataset can be found in Table 2. These numbers are significant because average and median rental prices varied across these cities, which impacts how the model generalizes across cities and to our European test set. Figure 2 shows that San Francisco has the highest average list price. Somewhat surprisingly, New York had the second-lowest average listing price in the dataset.
Figure 1: Heatmap of Airbnb listings across US cities.
Table 3: Number and proportion of Airbnb listings in each city for the US dataset.
Figure 2: Mean and median listing prices across American cities.
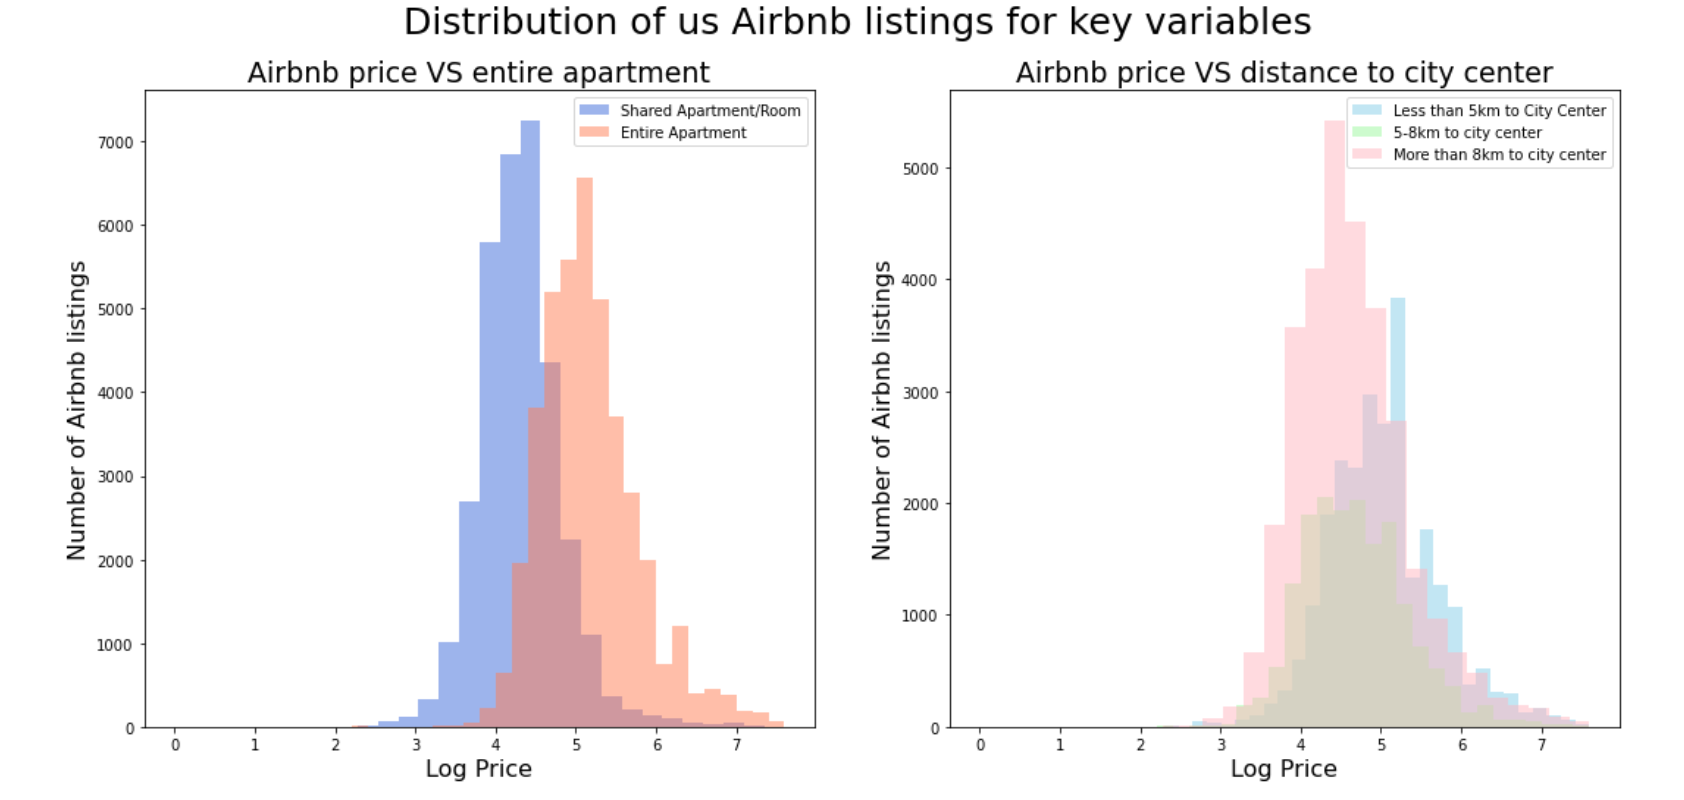
Additionally, we visualized the distribution of listing prices based on property type. As seen in Figure 3, we found those entire apartments had significantly higher prices than shared apartments and rooms.
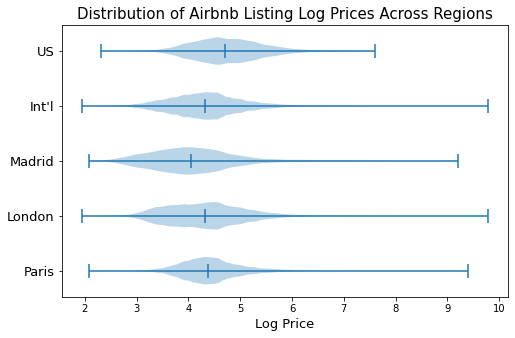
Since a key component of our study was generalizing our model to other countries, it was important to understand how they differed from the US. Figure 4 depicts the distributions of prices of Airbnb Listings across different regions. Despite European cities having a few Airbnbs that were highly-priced, the American ones had a higher median overall price.
Figure 3 : Distribution of US Airbnb prices across property types.
Figure 4: Distribution of Airbnb listing prices across regions.
C. Feature Engineering
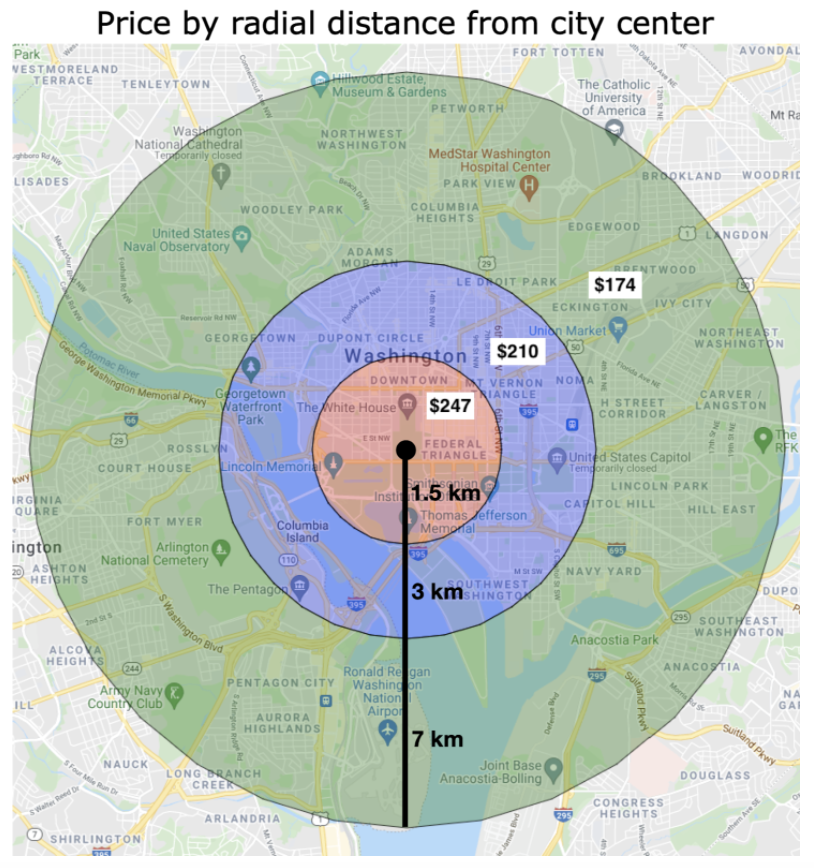
Based on the success of studies done by Zhang et al. (2017) and Ma et al. (2018) on geographical features influencing Airbnb prices, we took a similar approach to feature engineering. In particular, Zhang et al. determined how distances from the nearest highway and the Nashville Convention Center impacted prices of Nashville Airbnbs (2017). These studies inspired us to derive a similar but scalable approach to this by calculating the distance of Airbnbs to their respective city’s center. The potential impact this feature could provide can be seen below in Figure 5. The closer an Airbnb is to D.C.’s downtown, the higher the average price of an Airbnb is.
Figure 5: Average Airbnb Listing Prices in Relation to Washington D.C.’s City Center.
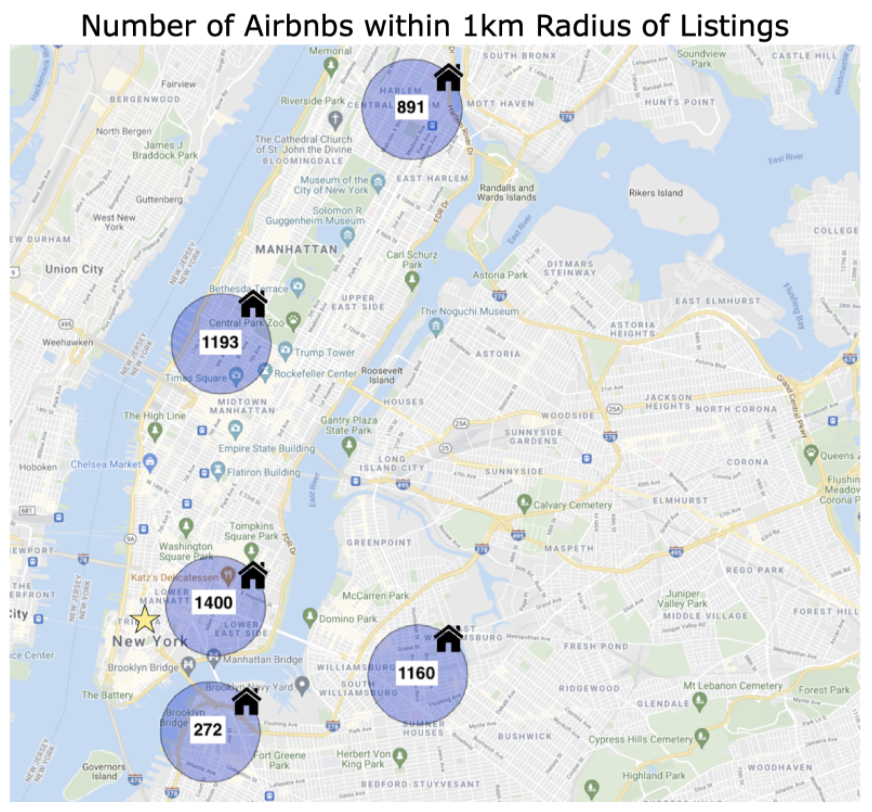
Based on an IEEE article that mentioned how Airbnb “constructs” neighborhoods through previous rental prices, we used another geographic approach to pick up latent density signals (2015). By calculating the number of Airbnbs within a one kilometer radius of each listing, we believe this could help identify potential hotspots within a city. Figure 6 shows a quick example of how this feature works on five randomly sampled Airbnbs within New York City. Many Airbnbs within the city have a large number of surrounding Airbnbs, despite being far from the city center (yellow star). For modeling purposes, this feature was normalized by the total number of listings within a city to account for larger cities.
Another feature of interest, amenities, was extracted from free text input directly by hosts. Using RegEx, we identified, cleaned, and standardized over 130 unique amenities. We then manually grouped similar amenities, and accounted for rare amenities by either removing them, or adding them to a larger group to prevent the model from overfitting on amenities potentially only found in the United States.
Figure 6: Number of Airbnbs Within a 1km Radius of 5 Randomly Sampled Airbnbs in NYC.
V. Methods
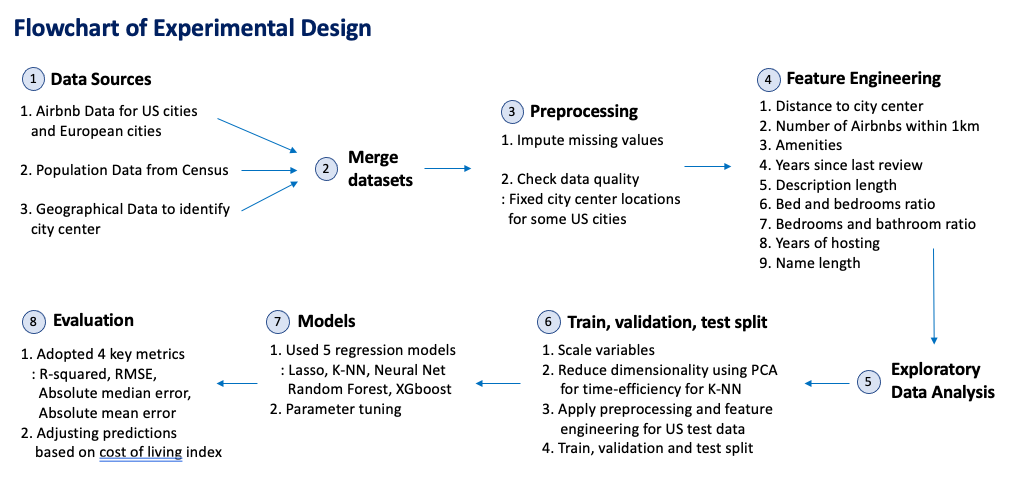
As shown in Figure 7, we took an eight-step approach to create a generalized solution to predicting international Airbnb prices. The first five steps have been covered in the prior data section.
Figure 7: Flowchart of Experimental Design.
Once the training data was prepared for modeling, we set aside 20% to create a validation set to finetune our models’ hyperparameters. For this study, five different test sets were used -- US, International, Madrid, London, Paris. The US test set contained about 14,000 observations with the same six cities found in the training set. The European test sets consisted of around 70,000 observations from London and Paris, respectively, and about 25,000 observations from Madrid. The International test set was created by concatenating the observations from all three European cities. Each test set was updated by imputing null values with the mean of the training set for their respective columns, and the same features were engineered to make the test set mimic the train set.
Five models were trained to determine the effectiveness of different modeling approaches on predicting American Airbnb listing prices and then generalizing those predictions internationally. The optimal model selected for this problem was based on metrics defined in the Evaluation section below.
Linear regression was selected as a potentially effective model to generalize predictions to European listings. By using Lasso Regression, we intended to reduce the amount of multicollinearity and noise within the features of our training set to help improve the model’s overall performance on the test sets (Tersakyan, 2019).
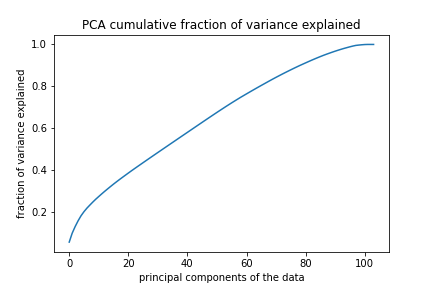
Thuraiya et al. showed that KNN is a good baseline model for predicting housing prices (2020). Considering the research by Yu et al., where algorithms with PCA performed better than the ones without, and also the issues with training time, we performed Principal Component Analysis (PCA) on the dataset before fitting the model (2016). Based on the cumulative variance explained and validation accuracy, the optimal number of components was 15 and the optimal K-value chosen was 7.
Figure 8: Cumulative Fraction of Variance Explained by PCA by N Components.
Based on the results of the KNN regressor, we selected another non-parametric model to pick up on the flexible relations found within the training dataset. The optimal model was selected through a Random Search over a few hyperparameters such as the number of trees, the maximum depth of the tree, and a few others. Additionally, the random forest was bootstrapped to reduce overfitting while training.
From the study conducted by Kokasih et. al., their implementation of XGboost was found to perform extremely well at predicting rental prices (2020). Additionally, the success of another tree-based in Random Forests, encouraged us to try more sophisticated tree-based models like XGboost.
An MLP regressor was chosen to see how well a black box model could perform compared to our other models. Based on a previous study by Kalehbasti et al. (2019), neural networks were able to fit similar training datasets well with a high R2. Using Random Search, the optimal network architecture contained 2 hidden layers with 200 neurons in each layer, with relu activation functions.
C. Adjusting Predictions
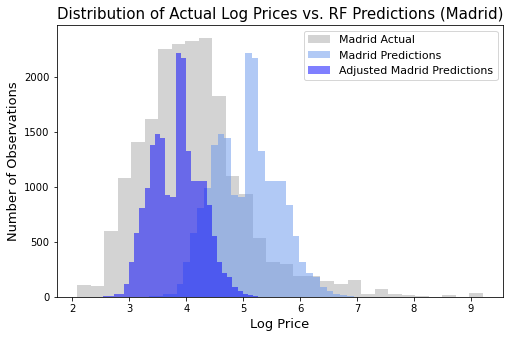
While performing EDA, we discovered that the distribution of Airbnbs prices were different across countries and especially when compared to the US. According to Handbury, one plausible reason for this discrepancy could be due to cost of living differences between regions (2019). Thus, we scaled our predictions by the CLI for each country relative to the US. For the international data set predictions, we took the weighted average between the CLI and the number of Airbnbs in each country to scale our predictions.
The most significant example of how this impacted our predictions can be found in predictions for Madrid. The CLI of Spain is 75.8, meaning products in Spain are 24.2% cheaper than they are in the US. Therefore, we scaled our price predictions by that same factor. The magnitude of this adjustment was visualized in Figure 9.
Figure 9: Distribution of Random Forest predictions for Madrid before and after being adjusted by CLI.
D. Evaluation Metrics
The most important metrics used to compare model accuracies were the R2 and RMSE, particularly on the International and American test sets. Additionally, the mean and median absolute error were secondary metrics calculated to better interpret our results. These values correspond with the mean and median number of dollars our predictions were from actuality.
A baseline for each test set was derived by calculating R2, RMSE, Mean and Median Absolute Error using the mean price of the training set to predict the price of every Airbnb in the respective test set.
VI. Results
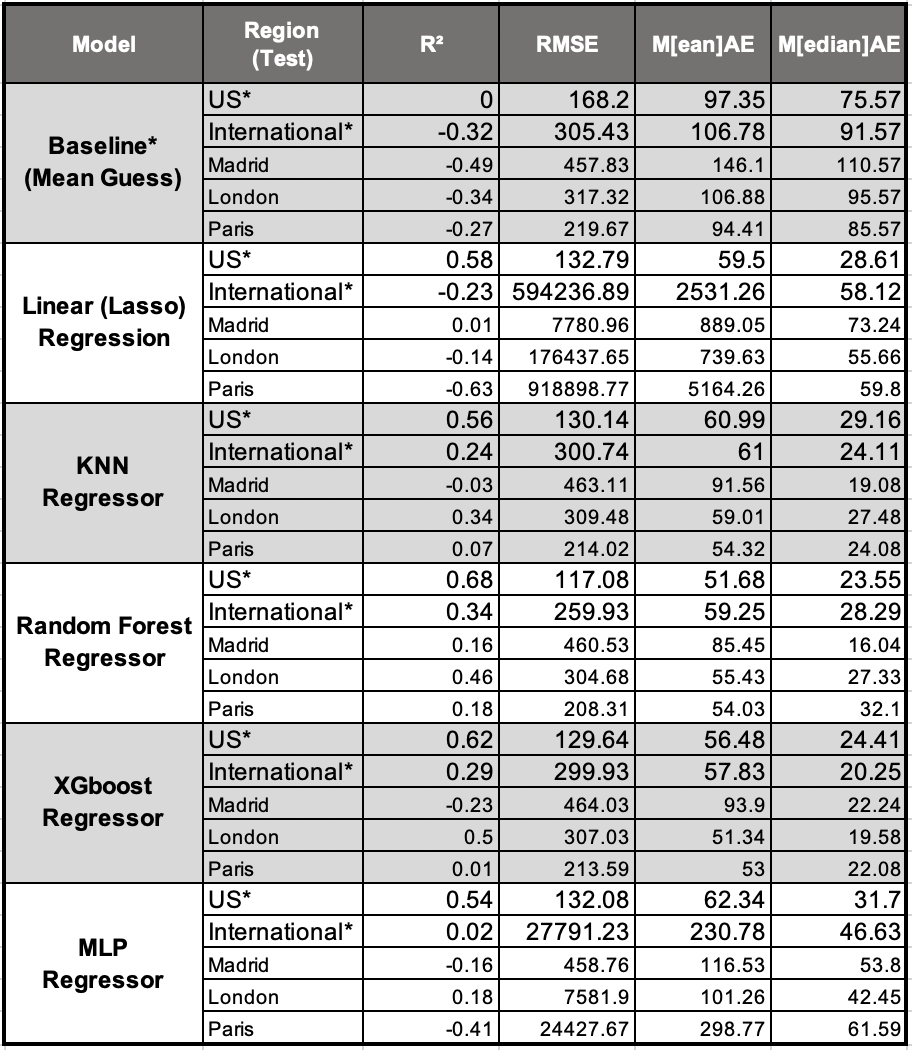
The R2, RMSE, Mean Absolute Error, and Median Absolute Error for each model and the baseline metrics can be found in Table 1 below. While every model outperformed the baseline R2 scores, the same was not true for the RMSE. Both Linear (Lasso) Regression and the MLPRegressor struggled to translate American listing prices to their international counterparts and performed significantly worse than the baseline. Based on the distribution of predictions in Figure 10, this is likely caused by both models making larger price predictions, while others were more conservative. These errors likely skewed the RMSE values to be much larger than the baseline and other models.
Table 4: Accuracy Metrics for Each Model.
*US and International test datasets are an aggregation of multiple cities.
*Baseline is not a model, just the mean guess.
Surprisingly, the KNN and XGboost regressors had lower median absolute errors in the International test set than the US. One possible explanation is there are only half the number of cities in the international test set than there are in the American one, and therefore still more price fluctuation.
Ultimately, the Random Forest performed the best on both the American and International test sets after having the largest R2 and smallest RMSE. XGboost and KNN, both did well but performed slightly worse, particularly on the Madrid and Paris test sets. The Random Forest Regressor was able to predict the price of an Airbnb in the US within $52 compared to $59 internationally. Additionally, the median prediction was within about $24 in the US compared to $28 internationally. Compared to the results produced by Kokasih et. al., our models performed relatively well compared to the mean absolute error (2020). Although they had slightly lower errors, we suspect that this is due to their study being focused on Singapore.
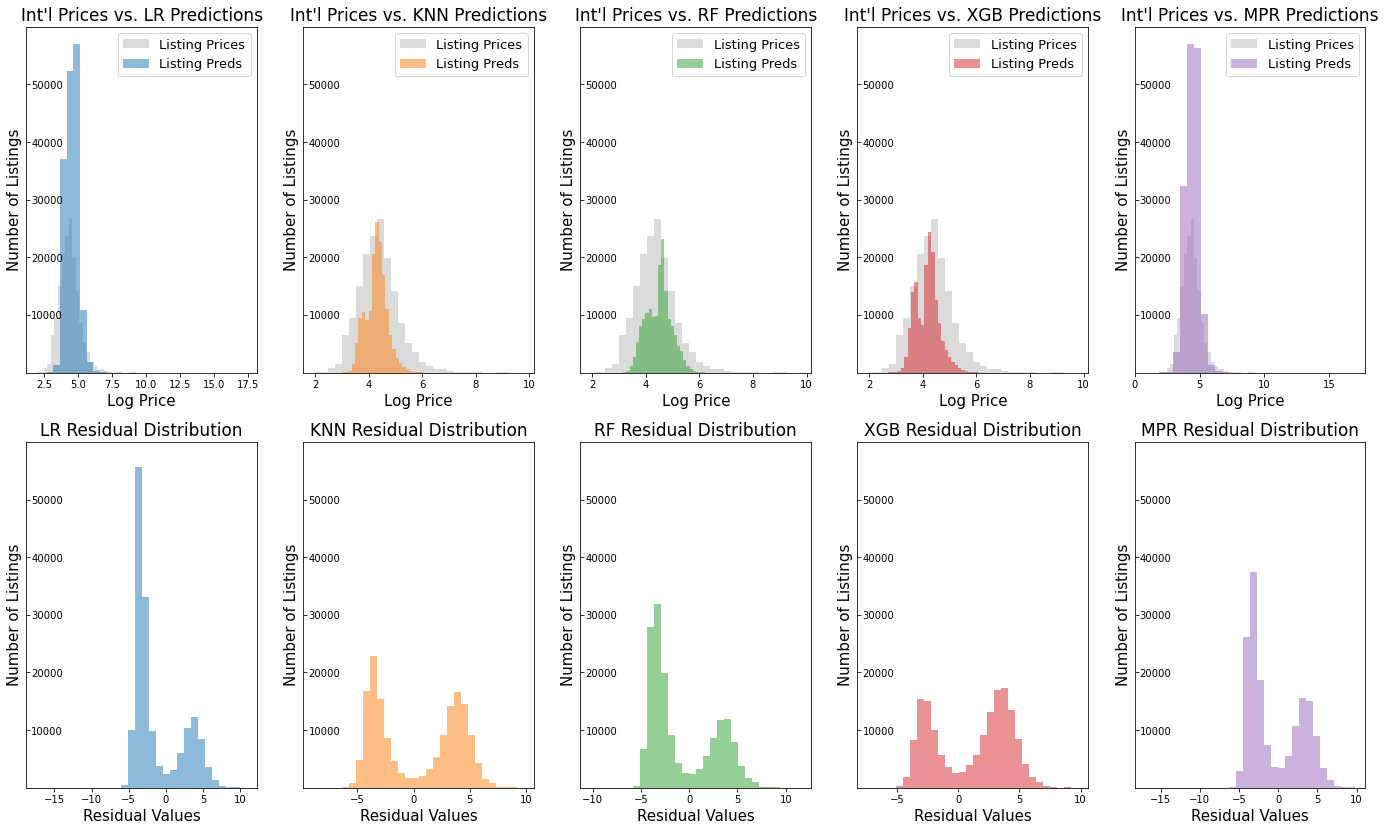
The distribution of each model’s predictions, along with the associated residual distributions can be found for the US in Figures 10 and for the European cities in Figure 11 below. Confirming what was found in Table 1 above, Figure 10 depicts how well the predicted price distributions overlap the actual Airbnb listings prices in the US. Each model, on both test sets, also had a bimodal residual distribution centered around zero. The closer these bimodal peaks are to zero, the better the model, such as the distribution for the Random Forest.
Figure 10: Distribution of price predictions versus actual (top) and distribution of residuals (bottom) for each Model on the US test set.
As expected, the prediction distributions of the KNN, Random Forest, and XGboost models were very similar on the international dataset. One slight difference that may have given the Random Forest a performance boost was its ability to predict a wider range of prices close to the median, as evident by its distribution curve in Figure 11.
Figure 11: Distribution of price predictions versus actual (top) and distribution of residuals (Bottom) for each model on the International test set.
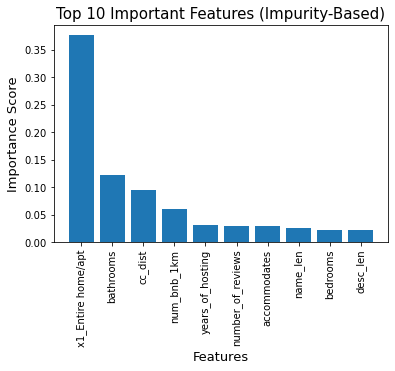
To get a better sense of what was important for predicting prices for the Random Forest model on the training set, the normalized Gini-Importance was calculated for each feature. The larger the value, the higher the importance. As can be seen in Figure 12, the single most important feature in predicting prices was whether or not an Airbnb was listed as an entire home or apartment. The geographic features engineered were two of the five most important features in predicting price, confirming the validity of the concept.
Figure 12: Top 10 important features for predicting listing prices based on Gini Importance (Random Forest). The feature, ‘entire home/apt’ refers to the property type, ‘bathroom’ is number of bathrooms, ‘cc_dist’ is the distance to the city center, ‘num_bnb_1km’ is the number of Airbnbs within 1km radius, ‘years_of_hosting’ indicates the years that the host has been hosting, ‘name_len’ refers to the length of Airbnb name, and ‘desc_len’ indicates length of the Airbnb description.
VII. Conclusion
This study developed a modeling and feature engineering approach that not only performs well at predicting Airbnb rental prices within the United States but also globally. Based on property characteristics and geographic features, we were able to train multiple models that generalized beyond the geographic location it was trained upon. Based on the predictive power, we concluded that property type, the number of bathrooms, and the distance an Airbnb is to the city center is critical in predicting the price of a listing.
The results from the Random Forest Regressor showed that the model was able to outperform other techniques such as Lasso Regression, KNNs, XGboost, and MLP Regressors based on key metrics such as R2 and RMSE. The median prediction of this model was within $24 of the actual Airbnb price in the US compared to $28 internationally. Considering the nightly cost of anywhere from a couple of bucks to thousands of dollars, this range is acceptable.
One limitation our study did not account for is the impact Covid may have had on rental prices internationally. Although much of the international test data was acquired in 2021, our training data was acquired in 2018. According to Forbes, 29% of American hosts listed their properties at reduced prices, especially for those considered essential workers. The pandemic could have affected our study overall.
Some future work can be done to improve upon our results. First, this project was focused primarily on large, metropolitan areas. Obtaining training samples from smaller cities and testing the performance would be critical to implementing a generalized model on a global scale. Second, we believe that city demographics and tourism data have a huge impact on Airbnb demand and prices. Additional datasets related to these concepts may allow for greater prediction accuracy.
References
rental: A study of listings from 33 cities on Airbnb. com,” International Journal of Hospitality
Management, vol. 62, pp. 120–131, 2017.
(Machine Learning), 2016.
Roles:
Responsible for compiling, writing, editing, and presenting the final presentation. Worked on text feature engineering, trained and tuned the linear regression (LASSO) model. In charge of collecting, compiling, and presenting performance metrics. Help to bring them together into a coherent discussion of the results, combine plots when appropriate for comparison. Provide a coherent assessment of the results of all models and visualize them.
Responsible for articulating the approach the team takes to solve the problem or answer the question at the core of the project. Dealt with missing values imputation, duplicates detection and one hot encoding. Worked on PCA and the KNN model. Create a timeline, coordinate and convene weekly meetings on the project as well as facilitating an agenda for each meeting.
Led exploratory data analysis of the dataset, merged datasets, data cleaning, preparation, and feature extraction & engineering. Made sure training dataset was prepared for modeling, as well as cleaned and formatted all international datasets. In charge of random forest modeling and visualizing model metrics and predictions for the models (and adjusting predictions). Also responsible for ensuring that the final project content is well organized, documented, and commented in Github and could be easily used by other data scientists.
Lead the work on and contribute the most to the proposal and progress reports. Interpret the results and place them in the context of other work or potential impact on application domains. Responsible for the final review, quality assurance, and submission of the reports. Merge external datasets and word on data processing. Train and tune the XGBoost model.
Dive deeply into related references and interesting projects that have been conducted. Review the content and make sure the pieces flow reasonably well and work with the authors to improve the content and help with rewriting. Deal with text feature processing, create a matching dictionary for amenities. Train and tune Neural Network Regressor.
Timeline of Activity:
Activity | Timeline |
Brainstorming & Data Collection | |
Meeting 1, Discuss the project topic; divide roles | Jan 27 |
Meeting 2, Decide project theme; find related datasets | Feb 2 |
Find and read related references | Feb 7 |
Exploratory Data Analysis | |
EDA on the raw dataset, Finish final proposal | Feb 10 |
Project Proposal Due | Feb 10 |
Meeting 3, Discuss final proposal feedback; find European test sets | Feb 15 |
Data Pre-processing (deal with missing values, duplicates); more EDA and visualization | Feb 21 |
Meeting 4, Finish data processing on the US training data; complete progress report | Feb 23 |
Feature Engineering | |
Compare the features between US training data and European testing data and discard some features only appear in one dataset | Feb 26 |
Meeting 5, Discuss feature engineering | Mar 2 |
Read references; merge external data; feature transformation(for both US and European data) | Mar 4 |
Meeting 6, Discuss text feature engineering | Mar 5 |
Finish text feature engineering: One hot encoding, Split train, validation, test data, upload data processing notebook to git repo | Mar 12 |
Modeling | |
Meeting 7, Split modeling tasks | Mar 17 |
Progress Report Due | Mar 21 |
Train, validate, and tune the models | Mar 23 |
Meeting 8, Discuss the model performance; unify the evaluation metrics for all models | Mar 25 |
Upload evaluation metric for all 5 models and compare the result | Mar 28 |
Meeting 9, Discuss plausible reasons for this discrepancy in performance on US test data and European test data | Apr 1 |
Read more references, Find out several reasons and adjust the prediction | Apr 7 |
Result Discussion & Finalizing | |
Meeting 10, Compare results to determine the final model | Apr 12 |
Upload the models to git repo and finalize git repo | Apr 15 |
Meeting 11, Prepare for final project presentation and final report | Apr 17 |
Finish the final project presentation, Upload the video to youtube, and win the judge's prize!!! | Apr 20 |
Final Presentation | Apr 21 |
Meeting 12, Finalize the final report | Apr 26 |
Final Report Due | Apr 26 |
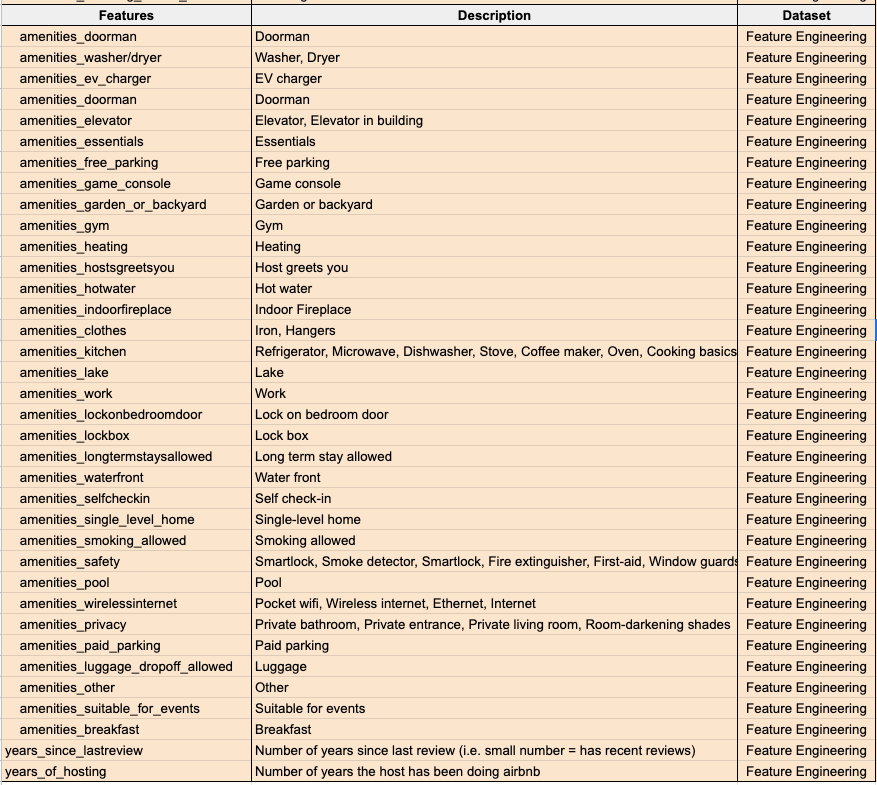
Appendix I. Data Dictionary
Appendix II. Additional Visualizations & Exploratory Analysis
Distribution of Airbnb Listing Grouped by Key Variables:
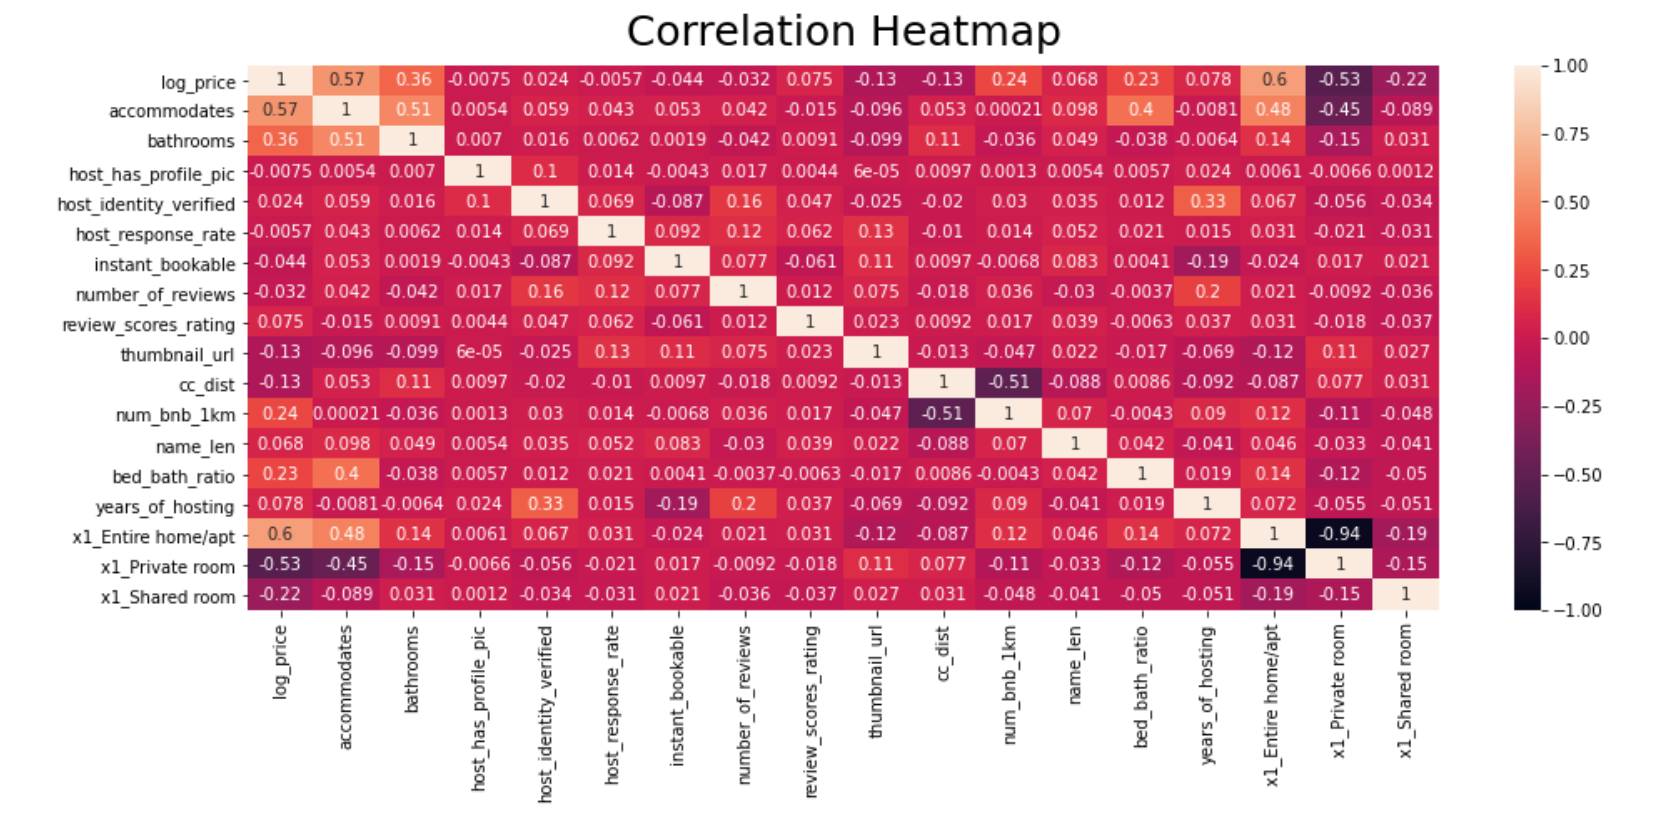
Correlation Heatmap for Main Features:
Appendix III. Github Repo