Combatting the Opioid Epidemic with Regulation
Assessing the Effects of State Policies
Prepared for: United States Department of Health and Human Services
Prepared by: Caleb Oneel, Sam Sloate & Tommy Tseng
October 2020
Motivation
Opioid prescription abuses and overdoses have rocked the United States for the past two decades. The number of opioids overdose deaths has quadrupled since 1999, and more than half a million people died due to drug overdoses from 2000 to 2015.[1] Recently, it has even contributed to a 2014-2017 decline in male life expectancy,[2] leading the President to declare a national opioid health emergency in 2017.
In response to the opioid epidemic, states have implemented policies with the goal of decreasing opioid prescriptions, addictions, and deaths. This analysis seeks to assess the effects of such regulatory policies on the volume of opioids shipments and drug overdoses. If state policies are shown to effectively decrease opioid prescriptions and deaths, they can be used as justification for, or frameworks of, future interventions.
Specifically, three states enacted stricter opioid regulations between 20007 and 2012--Florida, Texas, and Washington. This report examines changes in opioid shipment trends before and after Florida’s new policy, as well as changes in opioid overdose trends before and after the new policies in all three states. A summary of the policies is as follows:
Data
Data for this analysis came from the following sources:
Data were reported at the county level and were standardized to report per-capita opioid shipment weights in standardized morphine gram equivalents and per-capita opioid overdose deaths. Alaska was dropped as a potential comparison state because of substantial changes in their county boundaries during this time period.
Research Design
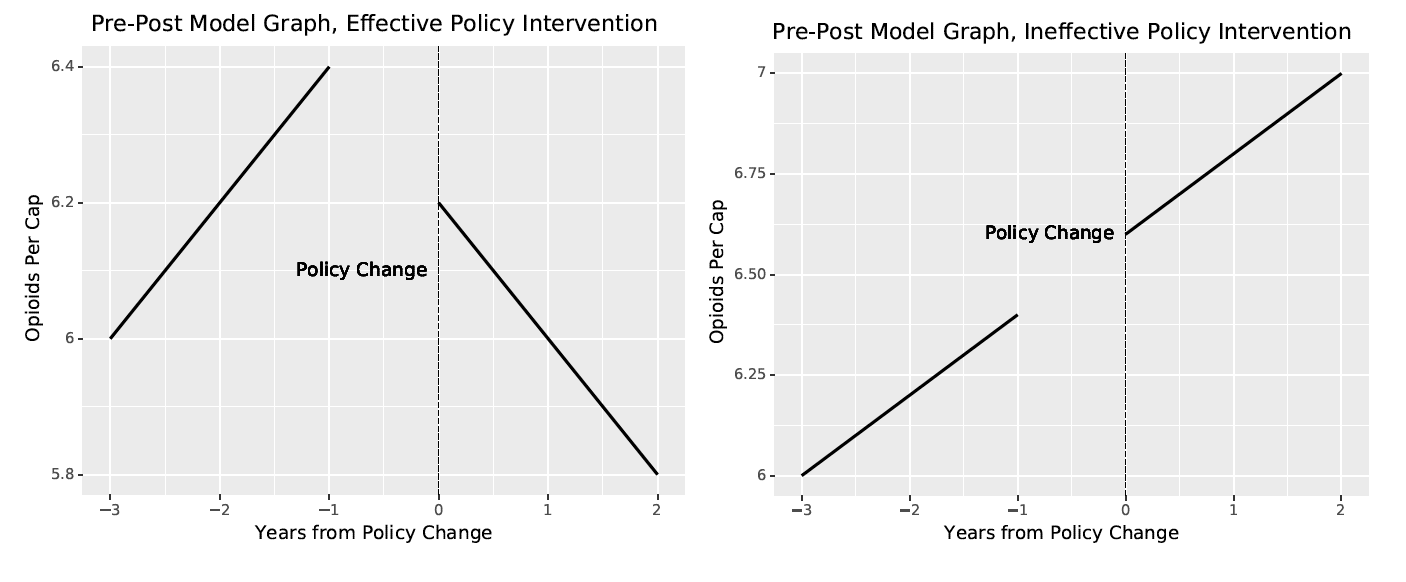
Two methods of analysis were used to evaluate the efficacy of states’ policy changes: a pre-post and difference-in-difference analysis. A pre-post analysis shows the effect of a policy change by measuring a variable’s trend before and after the change goes into effect. If the trend changes before and after the policy’s implementation year, the policy may be a cause of that change. In the context of this analysis, a pre-post graph sums the number of opioid shipments and opioid overdoses by year and graphs these numbers before and after a state’s new opioid policy went into effect. If the trendline decreases after the year the policy went into effect, there is evidence of the policy’s effectiveness on lowering drug shipments and deaths. If the trend does not change, the policy may not be effective. Figure 1 shows an example pre-post analysis graph for an effective and ineffective policy.
The pre-post analysis is a useful tool, but it is not without shortcomings: it does not leave room for external context or explanation. Pre-post analysis cannot account for external trends or situations that may impact the measured behavior or variable. Thus, any observed changes actually caused by an outside factor may be misattributed to the policy. For example, a hurricane in Florida in 2010 may cause supply chains to be disrupted and prevent opioid shipments from entering the state. A pre-post analysis would show a decline in opioid shipments, but that decline is not caused by Florida’s opioid policies. To combat this effect, a difference-in-difference (DID) analysis was used.
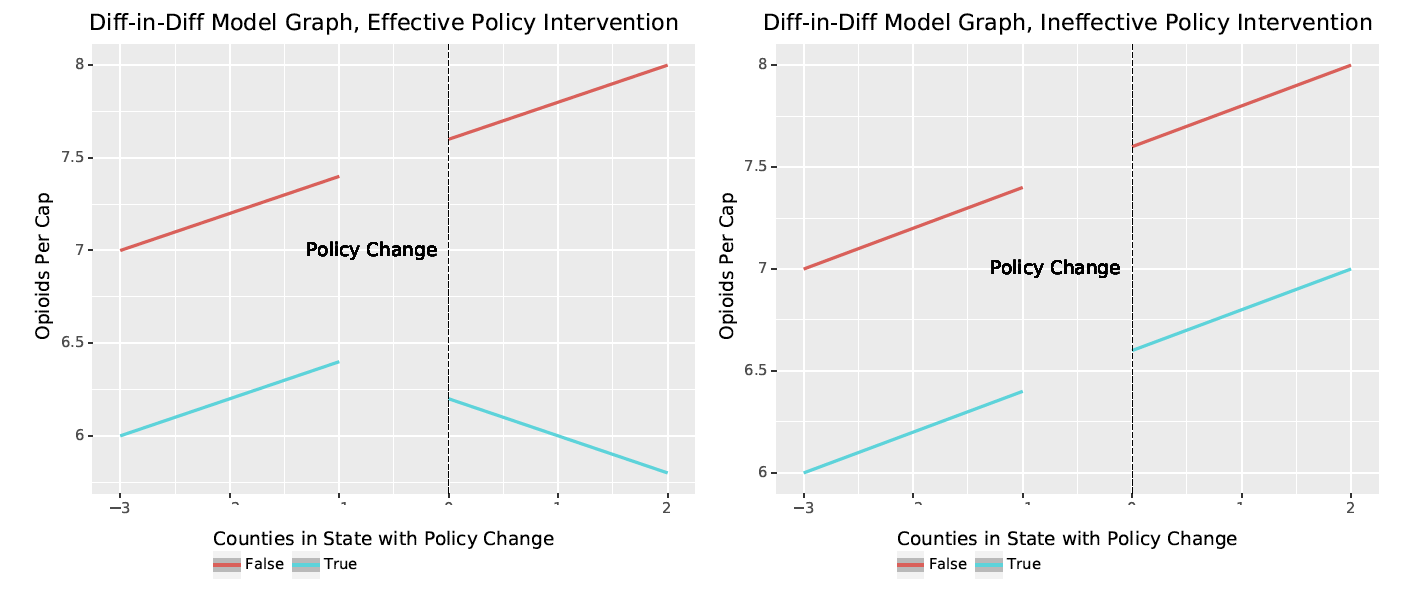
A DID analysis uses comparison regions over the same time period to provide a baseline trend. An effective policy would then have an effect above and beyond the trendline of comparison states. If an external factor affected trends in opioid shipments or deaths, this shock would likely be reflected in the target state and comparison states. For example, if a hurricane decreased opioid shipments to Florida and to surrounding states that were also impacted by the hurricane, a DID analysis could show that Florida did not have a decline in comparison to the other states. Thus, their policy was not effective as the pre-post analysis would suggest. For this analysis, states with similar pre-regulation trends were used as comparisons. Examining opioid shipments and overdoses trends before a state’s intervention and comparing them to the target states ensured that any observed effects were truly attritable to a policy change, and not external shocks. Figure 2 shows an example DID analysis graph for an effective and ineffective policy.
Figure 1: Pre-Post Analysis Example[3]
Figure 2: Difference-in-Difference Analysis Example[4]
Analysis
Pre-post analysis
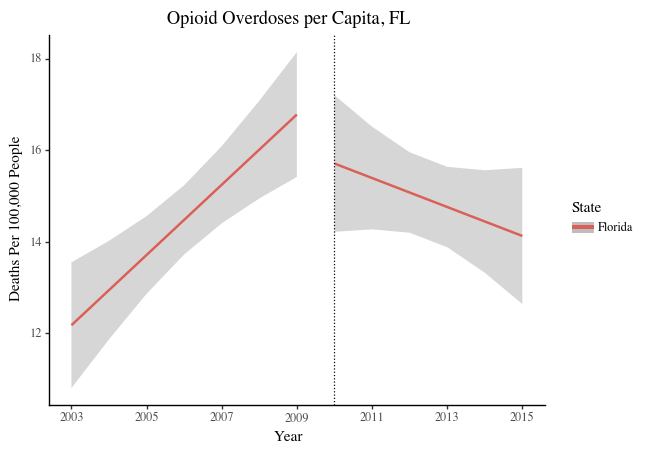
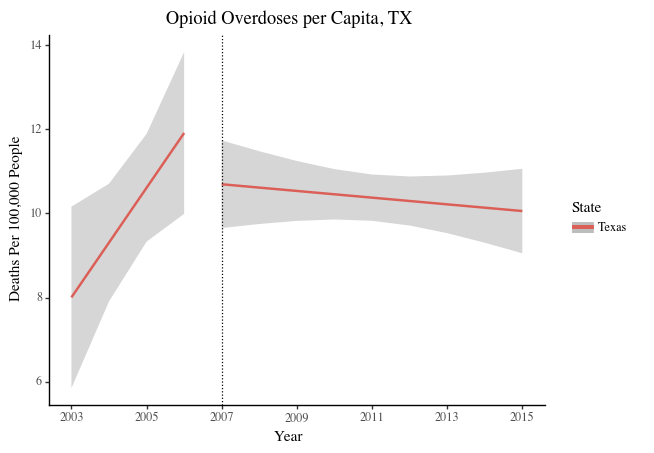
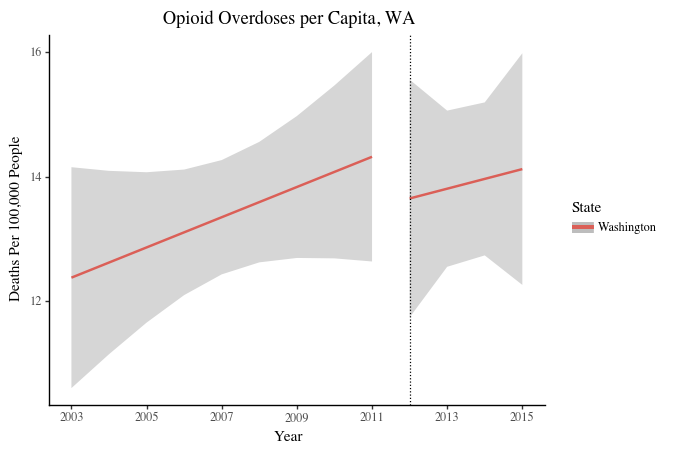
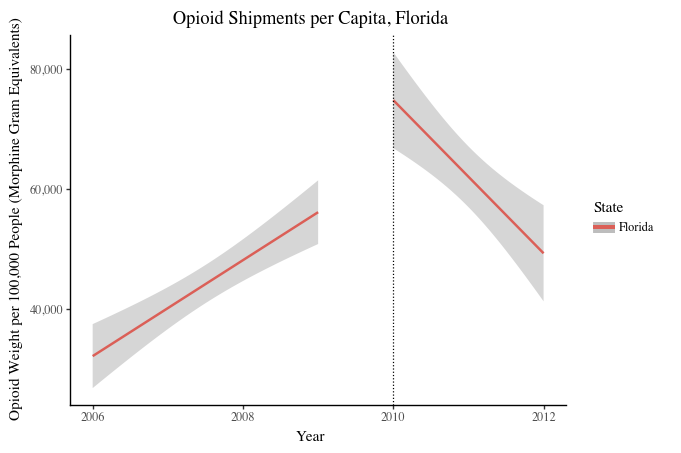
Pre-post analysis were conducted for opioid overdoses in Florida (Figure 3a), Texas (Figure 3b), and Washington (Figure 3c), as well as opioid shipments to Florida (Figure 4). Shaded bars represent confidence intervals.
Figure 3: Opioid Overdoses per Capita, Pre-Post Comparison
Figure 4: Opioid Shipments per Capita, Pre-Post Comparison (Florida)
Difference-In-Difference analysis
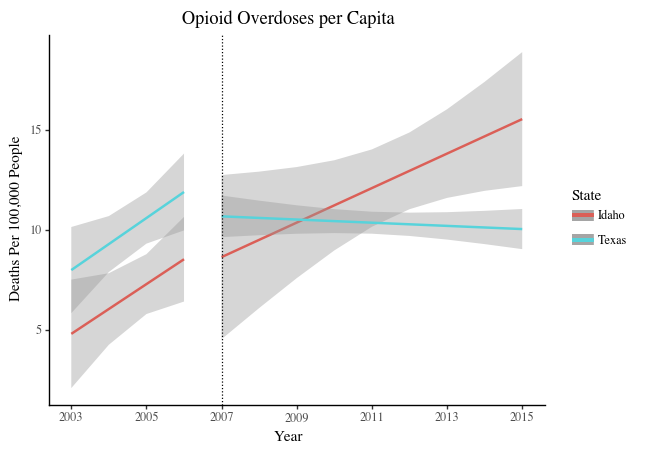
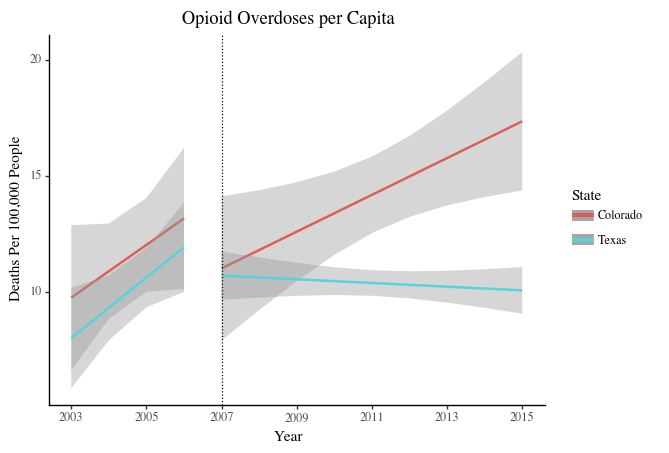
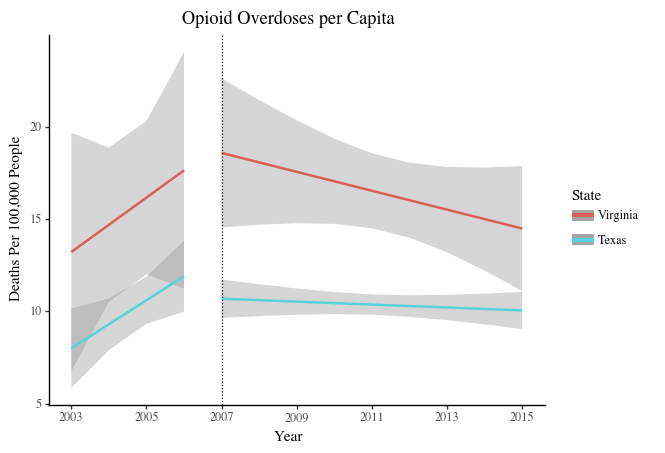
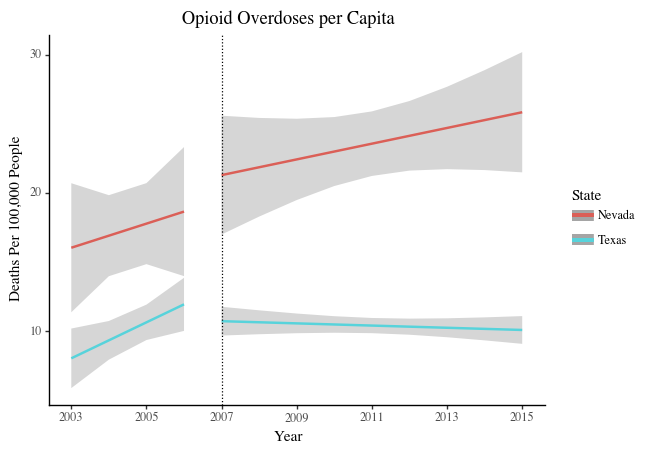
DID analyses were also conducted to compare trends in target states before and after their policy changes with trends in states without policy changes. DID analyses require comparison states with similar pre-intervention trends, so comparisons are effective. As such, comparison states that mirrored a targeted state’s trends in opioid deaths and shipments pre-intervention were selected. Opioid death comparison states were selected by graphing the data for all 50 states and examining the pre-policy trend as compared to the respective targeted state. Six comparison states with parallel trends for each targeted state were selected to increase the sample size and therefore the robustness of the model, and are as follows:
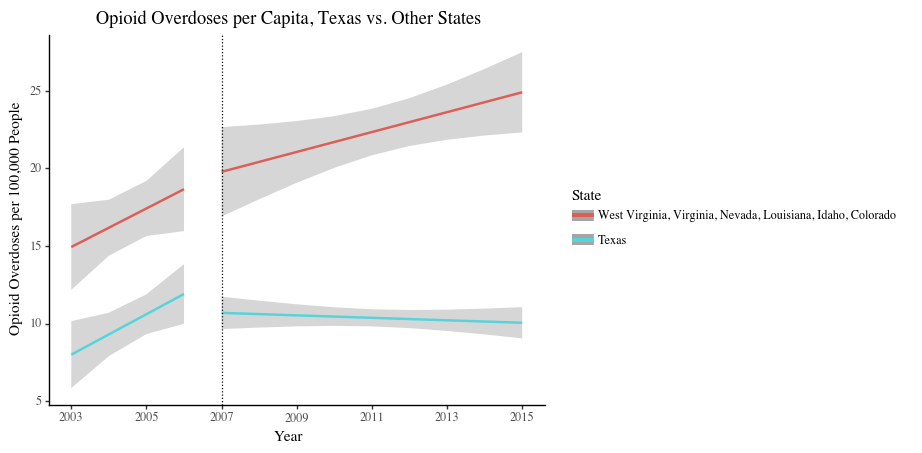
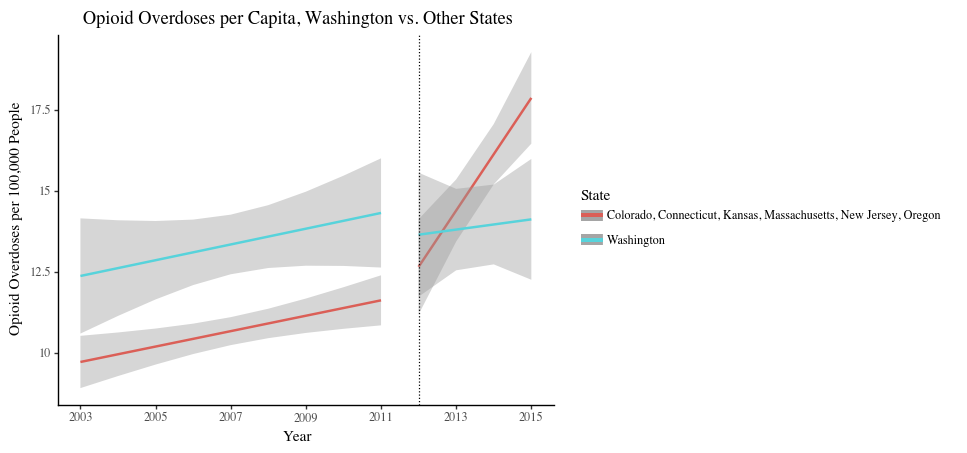
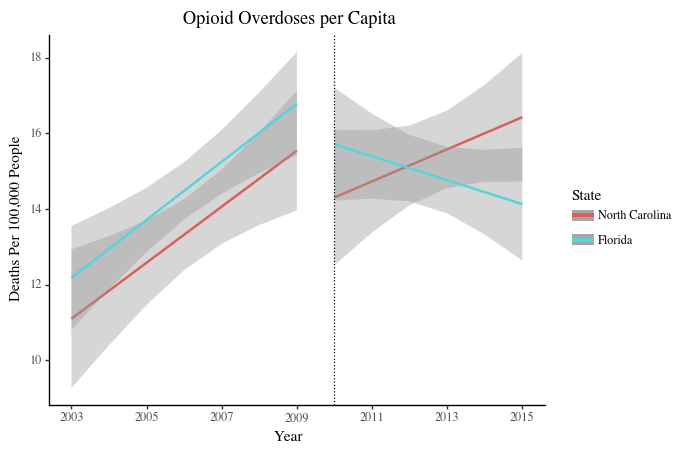
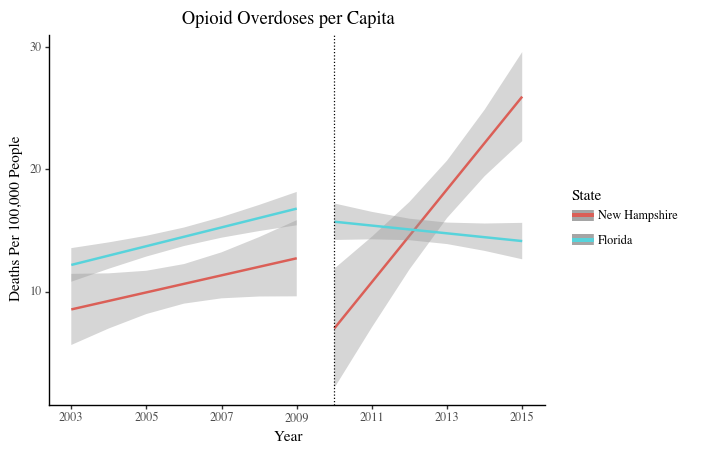
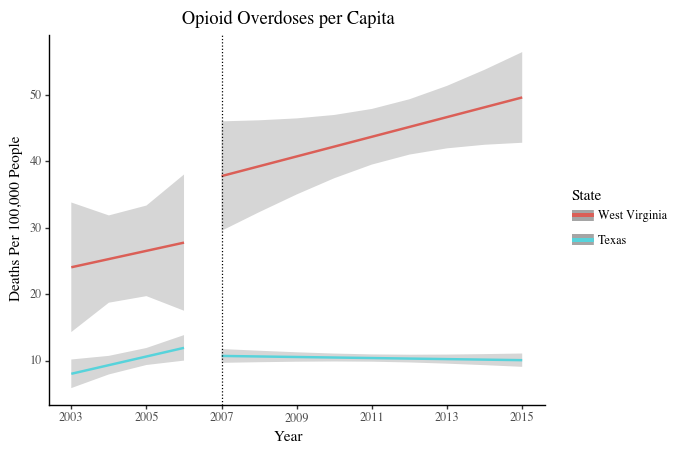
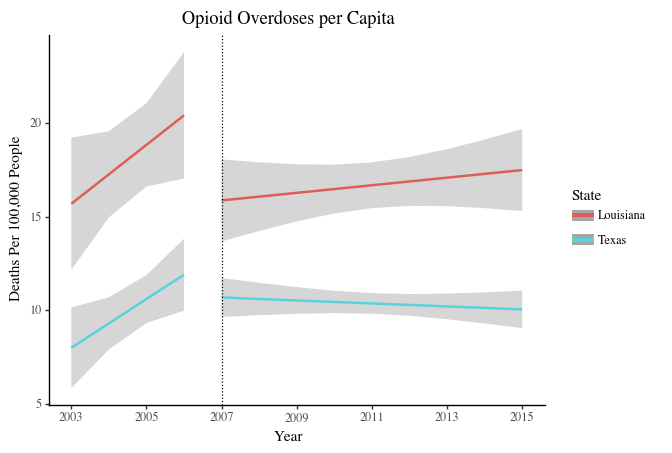
Appendix A contains graphs of opioid overdoses rates in the chosen states above for Florida, Texas, and Washington. The comparison states for each targeted state were graphed together and compared to the targeted state, as seen in Figures 5a-5c below.
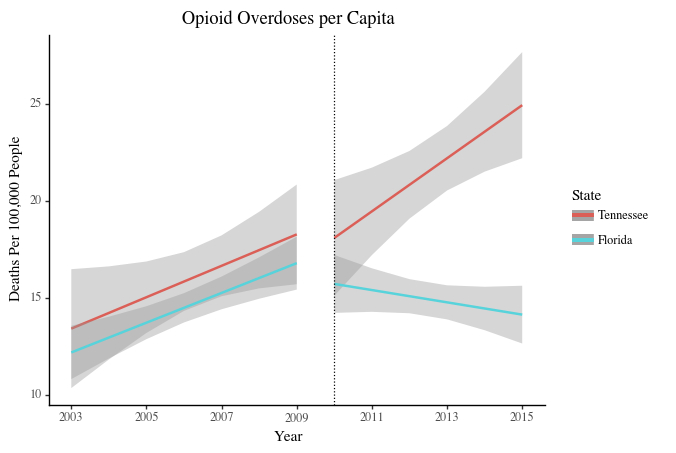
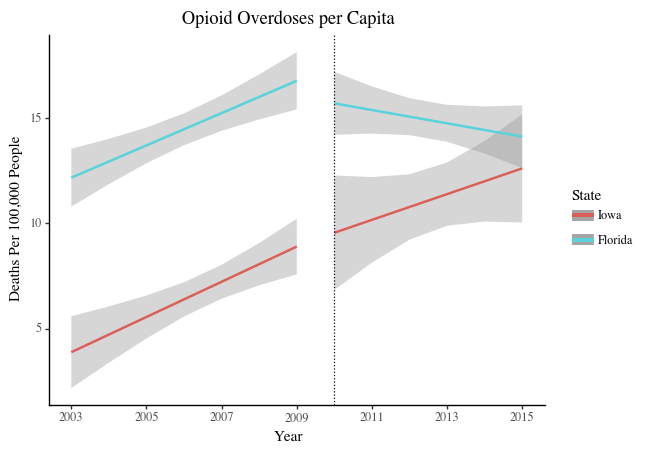
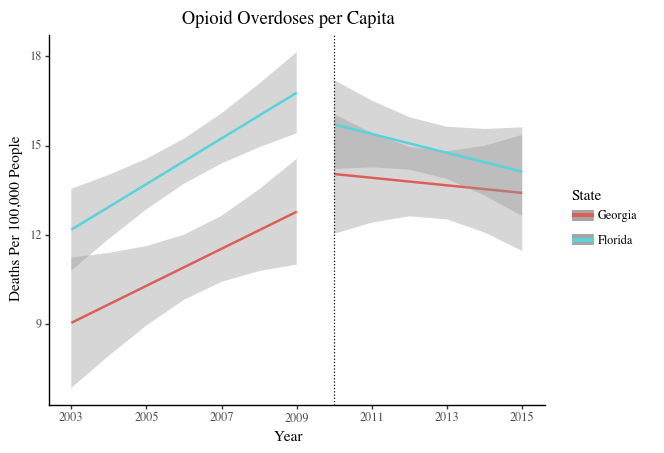
Figure 5: Opioid Overdoses per Capita, DD Comparison
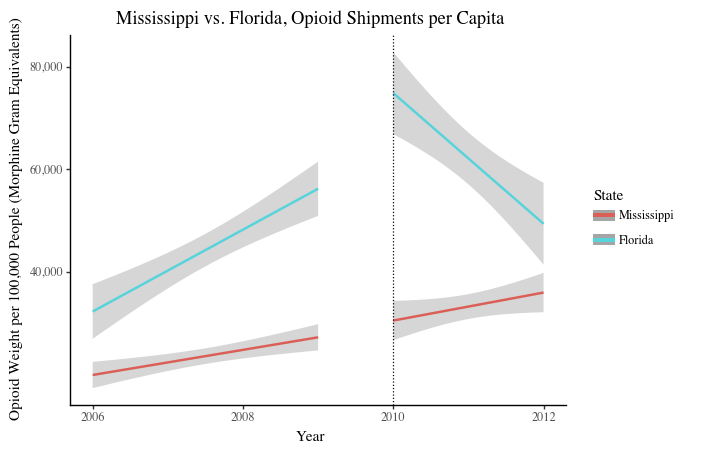
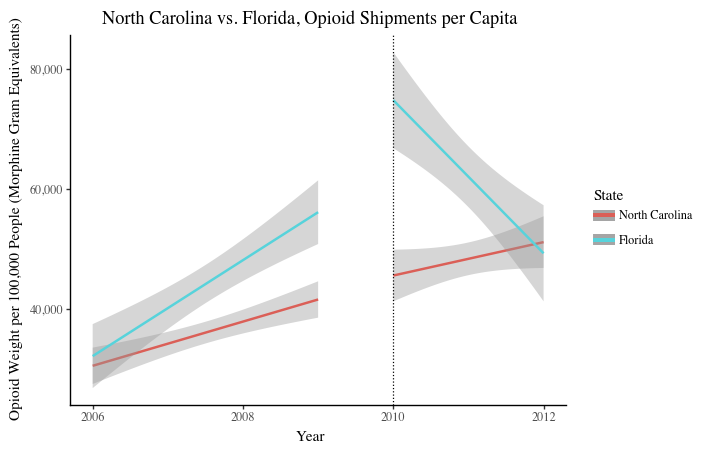
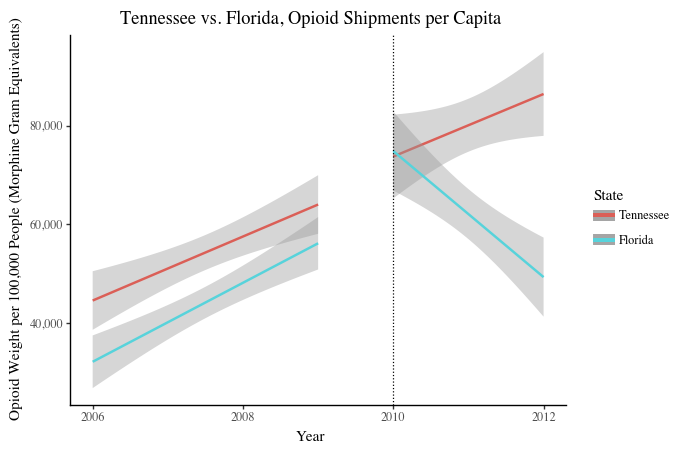
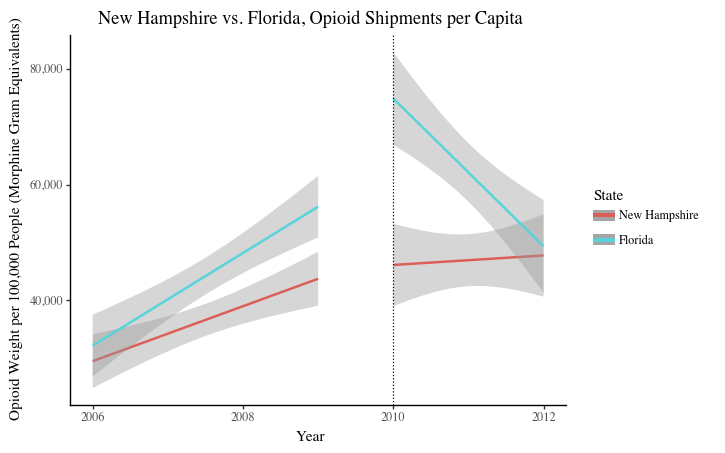
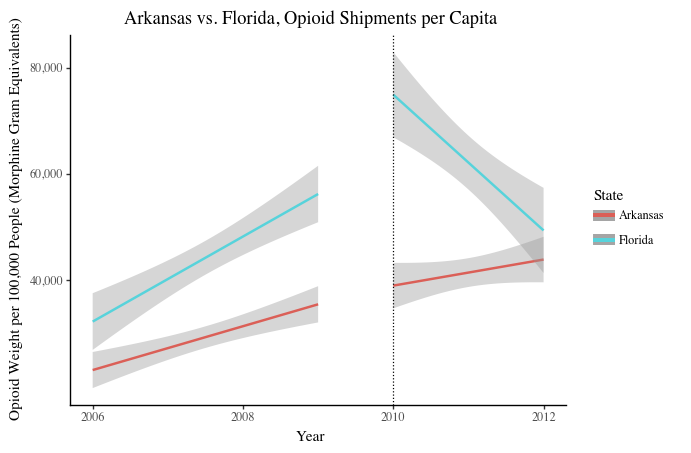
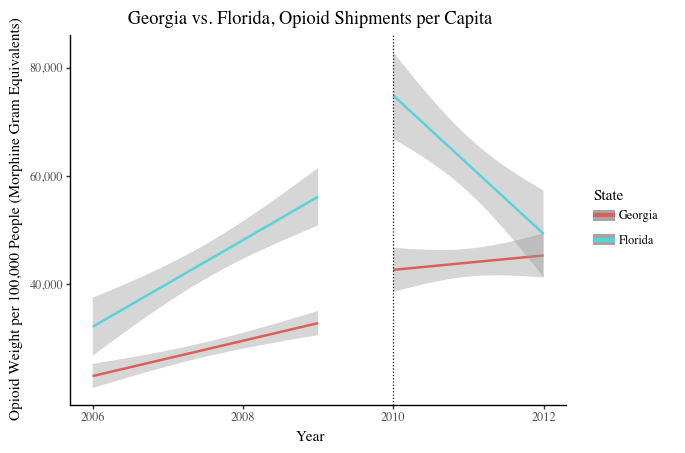
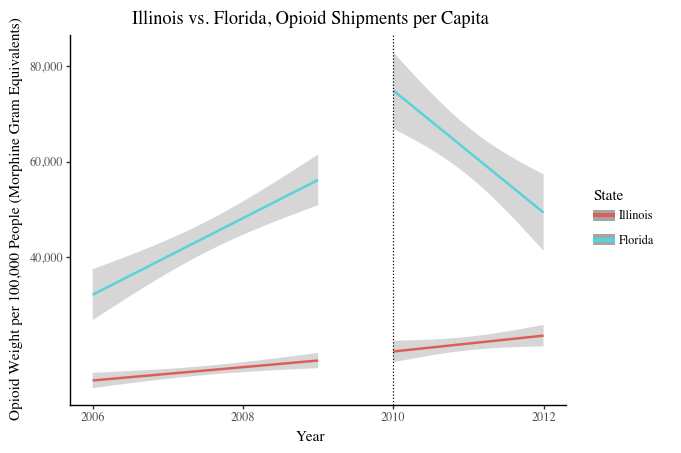
Because the opioid shipment dataset was large, opioid shipment comparison states were pre-selected based on geographic region and opioid overdose trend similarities. The chosen comparison states either were close to Florida or had similar trends in opioid deaths, in the hopes that some of their pre-intervention opioid shipments trends mirrored trends in Florida. Appendix B contains graphs of opioid shipment rates in the chosen nine states: Arkansas, Georgia, Illinois, Iowa, Michigan, Mississippi, New Hampshire, North Carolina, and Tennessee. Three comparison states with parallel pre-intervention trends--Arkansas, Tennessee, and Georgia,--were selected. The difference-in-difference analysis can be seen in Figure 6 below.
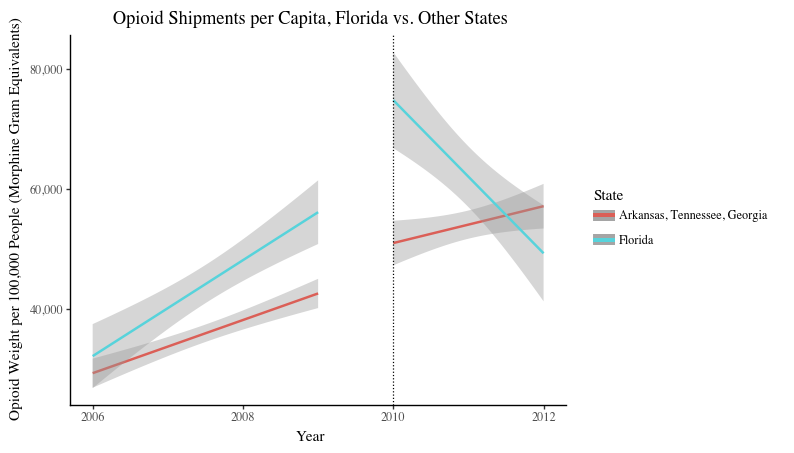
Figure 6: Opioid Shipments per Capita, DD Comparison (Florida)
Interpretation
Opioid Overdoses
As seen in Figures 3a-3c, per capita opioid overdoses in Florida, Texas, and Washington were increasing before the states changed their opioid policies. Florida saw a sharp decline in overdoses after implementing their policy, while Texas saw a slight decline and Washington saw a slower rate of increase. The DD analysis in Figure 5a show that Florida’s comparison states continued their trend of rising opioid deaths after the intervention year, so Florida’s decline in opioid overdoses was likely due to the new policy. Although Texas saw only a moderate decline in deaths, overdoses continued to rise in other comparison states (Figure 5b). Therefore, Texas’ policy likely helped to combat their expected trajectory of rising opioid deaths. Lastly, Washington’s opioid policy also slowed its expected overdose trajectory: comparison states saw sharp increases in opioid deaths, whereas Washington’s rates rose only slightly (Figure 5c). In all cases, state opioid regulations are associated with declines in opioid overdoses. Measuring against comparison states provides compelling evidence that the decrease in overdose deaths can be attributed to the policy changes and not other external societal or cultural trends or events.
Opioid Shipments
As seen in Figure 4, opioid shipments per capita in Florida were increasing before the 2010 policy implementation but decreasing after, indicating that Florida’s policy may have been effective in lowering opioid prescriptions among the public. The DD analysis in Figure 6 shows that comparison states have similar or parallel trend lines to Florida before 2010, and continue their trajectories after 2010. Because the sharp change in slope seen in Florida’s graph was not observed in any three of the comparison states, it is likely that the decline in per capita opioid shipments was due to the opioid regulation policy.
Appendix A
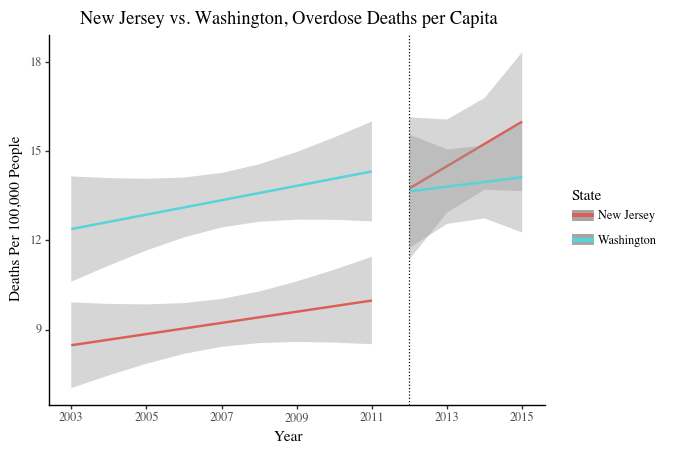
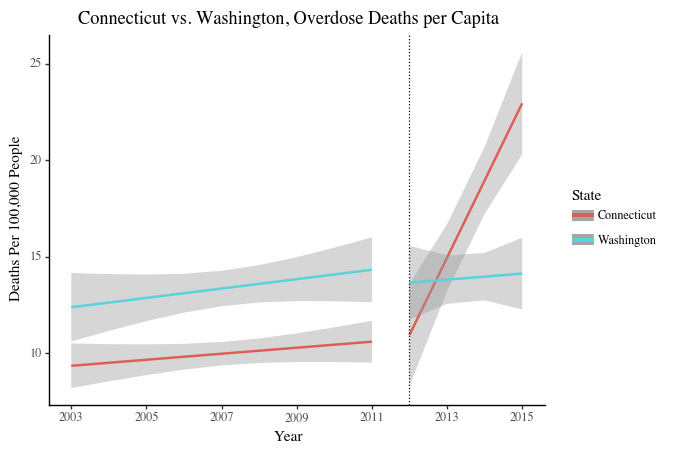
Difference-in-difference analyses of opioid overdoses rates in comparison states relative to Florida, Texas, and Washington
Comparison states:
Opioid Overdoses DD Analysis, Florida vs. Comparison States
Opioid Overdoses DD Analysis, Texas vs. Comparison States
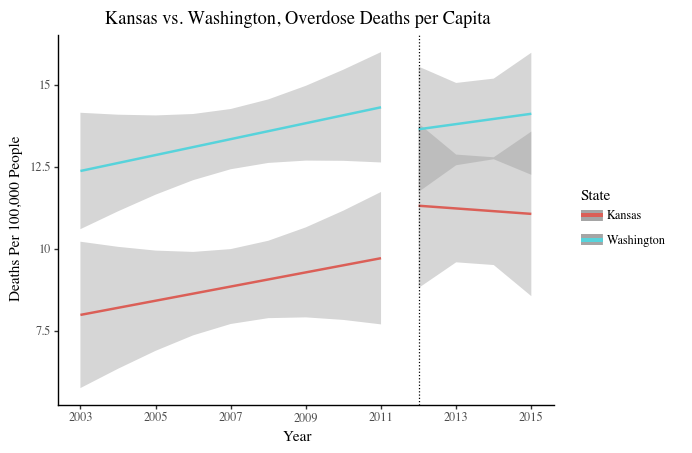
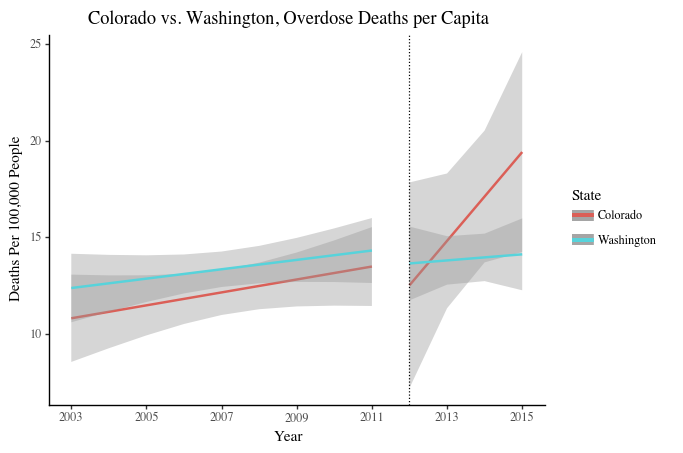
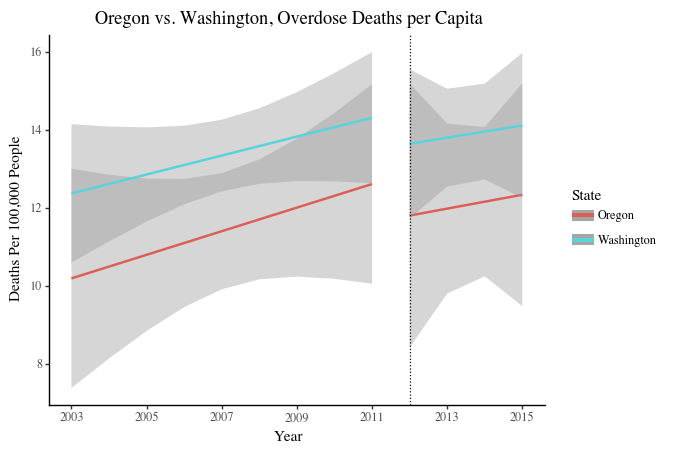
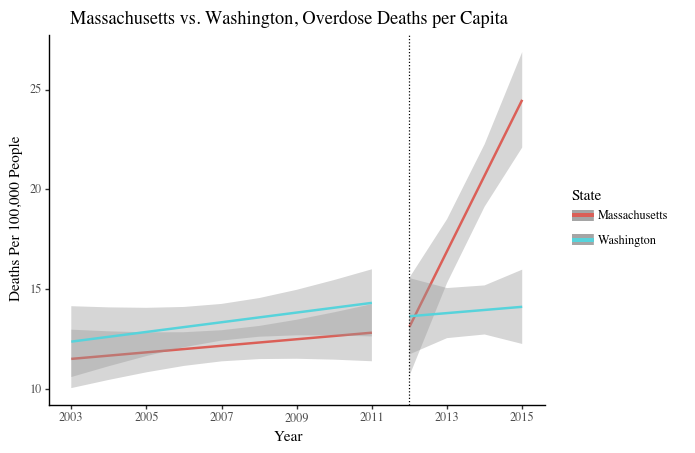
Opioid Overdoses DD Analysis, Washington vs. Comparison States
Appendix B
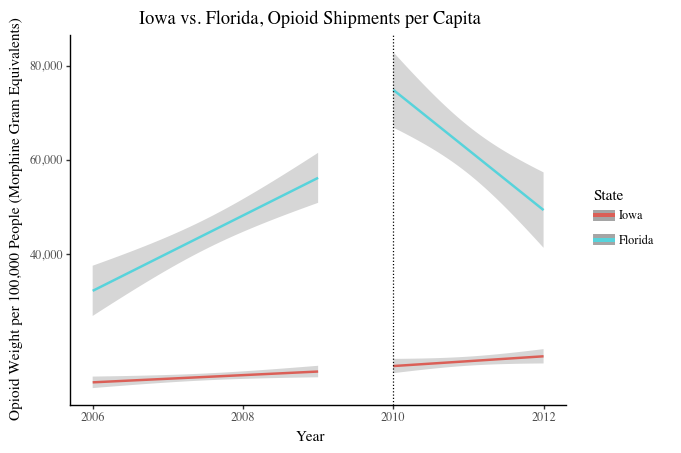
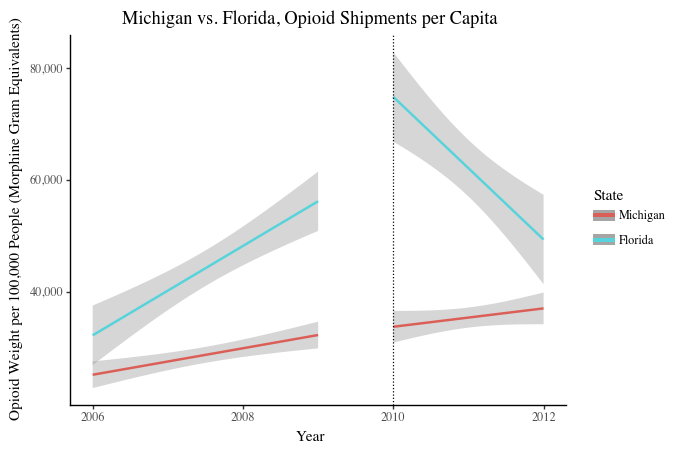
Difference-in-difference analyses of opioid shipment weights in comparison states relative to Florida
Opioid Shipment DD Analysis, Florida vs. Comparison States
[1] “Ongoing Emergencies.” (2020). Center for Medicare and Medicaid Services. Accessed October 26, 2020. https://www.cms.gov/About-CMS/Agency-Information/Emergency/EPRO/Current-Emergencies/Ongoing-emergencies.
[2] Gold M. S. (2020). The Role of Alcohol, Drugs, and Deaths of Despair in the U.S.'s Falling Life Expectancy. MO Med, 117(2), 99–101.
[3] Eubank, N. (2020). “Estimate the Impact of Opioid Control Policies Mid-Semester Project,” Practical Data Science, Duke University. Retrieved from https://www.practicaldatascience.org/html/index.html.
[4] Ibid.